
Creating a data pipeline can be a messy job. A typical company has a huge number of data sources that generate important data on a daily basis, and it’s up to the data analysts, scientists, and engineers to turn all this information into something that people can actually use to make smarter decisions. Here is a take on how Envoy leverages data transformation for achieving data modelling at scale.
This post was originally published in Stitch.
At a high level, the data architecture at Envoy follows the extract-load-transform (ELT) paradigm to get our data into a usable state. (If you want to know why we use the ELT paradigm rather than the more traditional ETL paradigm, I would suggest starting with this well-written article.) As the name implies, the three main steps are extracting data from where it is generated, loading it into a data warehouse designed for analytics, and then transforming that data into something that people across the company can actually use.
For the E and L components of our pipeline, we use data ingestion tools like Stitch along with a few custom-built data ingestion apps based on the Singer framework that handle ingesting data from sources that don’t yet have commercially available data loaders. While I could probably write several articles just on these two steps of our data architecture, I’m going to focus on the T, the transformation step. This is the step where you take all the raw data that you’ve worked so hard to get into your data warehouse and make it into clean data tables that can start to generate useful insight about your business and product.
Data Transformations 101
The very first “data transformation” that happens at a company is when the first analyst, let’s call him Mike, writes a SQL query and generates a report. It’s as simple as that: Some amount of data is taken and shaped into a digestible format that others in the company can understand.
Mike generates all sorts of reports and dashboards in his first few months on the job, and pretty soon is joined by data team member #2 — let’s call her Sandra. This is the point where previously unknown problems start to surface. In her reports, Sandra converts all the server timezones to PST, while Mike left them as UTC, causing monthly customer counts to be different. In another report, Mike filters deleted users out of his calculations, but Sandra includes them, resulting in different user counts that confuse the product team.
For a while these minor discrepancies can be managed through documentation and communication, but as a company and data team grow, data inconsistency and inaccuracy can become a huge drag on productivity if left unmanaged.
This is where the value of a transformation layer starts to shine. Instead of relying on analysts to apply consistent logic on raw data when creating reports, a more scalable approach is to package this logic into operations that clean and transform raw data in helpful ways.
For example, a simple transformation might be to convert all timestamps to PST, regardless of what timezone the raw data was in. When analysts use these “transformed” tables, they can use timestamps without having to worry about timezone conversions. More examples of useful transformations are deleting test accounts, removing spam email, and converting cents to dollars.
To take things even further, transformations can be used to collect and aggregate important information about an object so analysts don’t have to go hunting around the database for basic information. For instance, adding columns like total_revenue and first_payment_time to your accounts table might save analysts a lot of time, because they can then use those fields in their analysis without having to worry about computing them from the raw financial data.
Ultimately, the outcome of a solid transformation layer is a set of clean tables that the analysts can base their analysis on.
Transformations at Scale
Hopefully by this point you see how transformations can make your data team more productive, but you might ask what happens when the number of data sources continue to expand, and the data team continues to grow? How do you ensure that analysts can quickly understand which transformations already exist and are ready for use, and which ones need to be made from scratch? At Envoy we started running into these questions repeatedly; we have data from 40 different sources in our data warehouse and have nine data analysts who constantly create reports, dashboards, and analyses from all this information.
For several months, people were creating transformations on their own with minimal guidance or direction, and the result was absolute chaos. Hundreds of data transformations sprouted up within weeks, and no one could find things they were looking for. Many team members were re-creating transformation pipelines, since they didn’t know the one they needed at the time already existed. The time to run all these transformations was growing unsustainably. Column and table names were not consistent, and as a result we ended up with the very problem we were trying to solve with all these transformations in the first place: data inconsistency and data inaccuracy!
To give you a sense of the scope of this problem, here’s an example of the full DAG of a single data model that’s the foundation of all our financial metrics. Each node is a SQL transformation. The green nodes represent raw data.

Everyone knew this was a problem. Eventually we stopped kicking the can down the road and called a meeting to discuss things. We quickly realized that what we needed was a framework to organize our data transformation pipeline — something that would be easy to navigate, consistently named, and run quickly.
Bringing Order
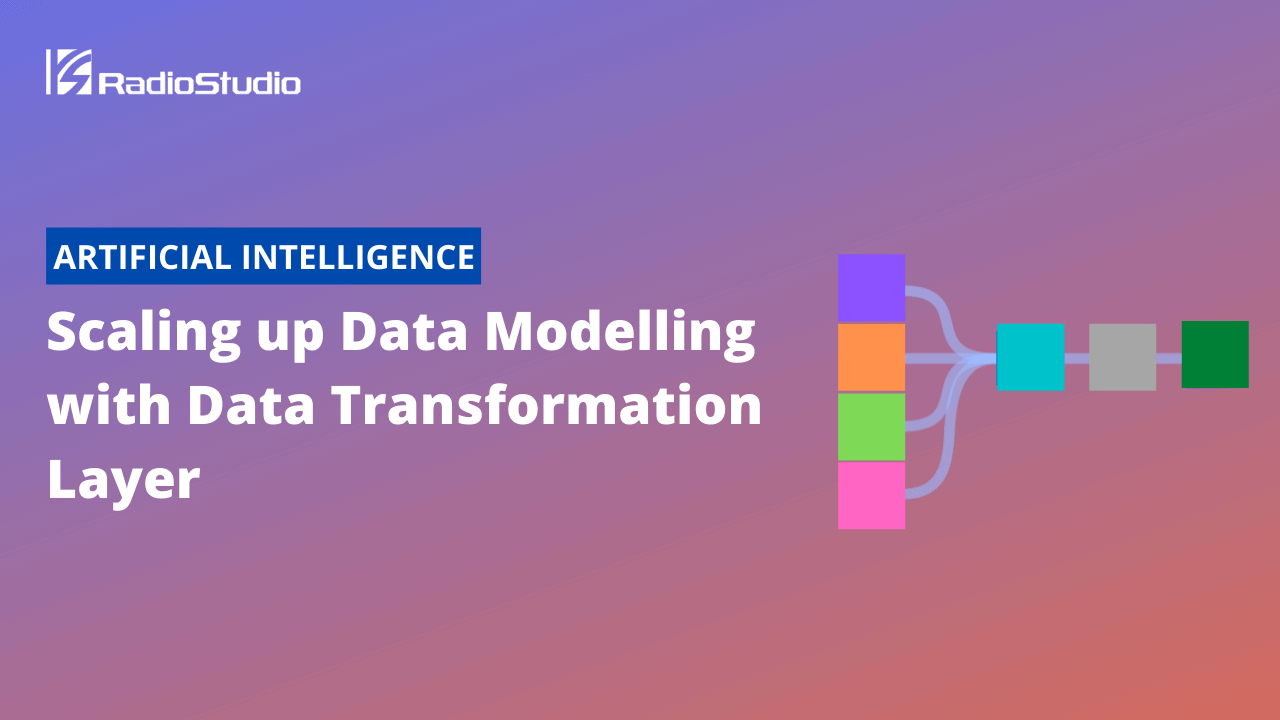
The framework we settled on relies on three layers: base models, transform models, and stakeholder models. Here’s a quick description about what happens in each layer:
Base — This is the only layer that points to raw data tables in our warehouse. Keeping raw data access confined to a single place in your data pipeline makes it easier to facilitate changes to the raw data itself. For example, things like schema name changes and column name changes only need to be made in one place. Doing this also allows you to standardize your data across many data sources by doing things like column aliasing, currency conversions, and timezone conversions. Some of our data sources send us data in UTC, while others send us data in PST. Some raw data points are stored in cents, while others are stored in USD. The base layer is where we standardize all of this, so downstream models don’t have to worry about timezone conversions or currency conversions at all. We also alias column names, for instance changing columns like external_account_id to envoy_company_id, to make fields more self-descriptive and minimize the time analysts have to spend poring through documentation.
Transform — This is the layer where we construct our core business objects, creating tables that represent important entities for our business, and a lot of associated metadata. For example, our most important table is our companies table, with each record representing a single account on our platform. There are columns designating how much revenue we make from each company, who the associated sales reps are, key product metrics for the company, and much more. The real benefit of this transform layer is that commonly used fields can be pre-computed and become easily accessible for analysts. Team members no longer have to go swimming through Salesforce or billing data to get basic information — it’s available right there on each record. Test records are also filtered out here, so the tables that are produced by this layer can be relied upon to contain only clean data. An additional benefit is that query times are typically reduced dramatically in our BI tool; since a lot of the data is denormalized and pre-computed, the need for joins and aggregations is reduced, which in turn makes most queries run much faster.
Stakeholder — The last layer we have in our transformation pipeline houses the models that are often too specific to be considered a core object. This layer relies on models from the transform layer, but applies custom logic that is specific to a certain use case. Some examples here are marketing attribution data models for the marketing team, or revenue recognition for the finance team. Having this layer gives us a place to put models that need to be truly customized. We organize this layer by each department in our company (finance, customer success, product, etc.) so it’s clear to an analyst where to put a custom model that he or she built for a stakeholder.
Separating data transformations into these three distinct layers improves the organization for the data team. When an analyst needs to add another column to a data model — maybe they want to add a time_to_conversion column on our salesforce_leads model — it’s clear where to put that logic. If a data source needs to be added for new types of analysis, it’s evident to each team member how to incorporate the necessary data transformations into our pipeline while maintaining consistency with the rest of the project.
As the project grows, this consistency makes finding things easier for all the team members. When there are only one or two analysts, this may not seem like a big deal, but as the data team grows, people can find themselves sifting through data transformations to find what they need, which can be a huge drag on productivity. Sticking to a consistent framework saves the team a lot of frustrating hours.
Final Thoughts
Coming up with a consistent framework and sticking to it has been an important factor in allowing our data team to scale with the company. Empowering analysts to build on our data infrastructure has minimized “knowledge silos” that often pop up as companies start to scale, and kept our time to insight down. Since any analyst has the ability to take raw data and create transformations out of it, the whole team can complete requests from end to end. And more importantly, enforcing consistency across our data has enabled us to move much faster, as we can move from one data source to another without having to familiarize ourselves with the nuances of each table.
Our transformation framework, processes, and infrastructure was the result of a couple of rounds of trial and error, and I’m sure it will continue to change as we grow. I hope the best practices we’ve learned can be helpful to any of you who are feeling the struggle of scaling a data team of your own.
