

Understanding why customers create support tickets helps you improve your products and services. By asking relevant questions to your support ticket data, you can build an automated dashboard that offers self-service analysis capabilities to get insights from your support ticket data, and spot problem areas to focus on.
More...
This post was originally published in Metabase.
Use Case: Automated Dashboard

Problem Statement
Building customized dashboards from third-party integrated applications becomes a challenge when exploring data to seek answers to specific questions.

Realization Approach
Metabase Cloud BI integrates with third-party applications and a plethora of data sources to offer a query builder interface that questions the data and gets answers for building automated dashboard.

Solution Space
BI teams can query and explore data intuitively to ask questions as general queries without getting into technical details of SQL or redeploying entire dashboards.
To get started, you’ll need a decide on a ticketing system, like Zendesk or Freshdesk, with a batch of tickets in the system.
Broadly, you can follow a four step process to configure the ticketing system and integrate with Metabase
1. Create a few lists from your existing ticket data
List the most common reasons people file a support ticket. Keep the reasons short and concise. For example, Bug or Feature Request. Use your existing tickets to determine ticket reason.
2. Use your lists to create custom fields in your ticketing system
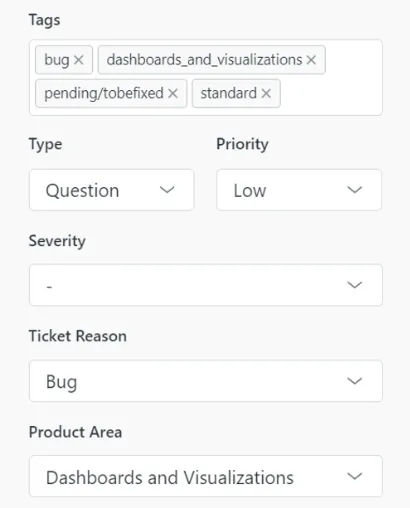
Now it’s time to plug those lists into your customer ticketing system. Create a custom field for ticket reason, product or service area, and additional areas, like biz ops, in Zendesk or any ticketing system you’re using.
After you’ve set up your custom fields, it’s time to start labeling tickets. Label a batch of existing tickets with reasons and areas. You can also require reason and areas to be filled in before a ticket is marked as solved, which will help you maintain a steady stream of new, incoming ticket data.
3. Connect your ticket data to your BI tool
To move the ticket data to your database or warehouse, and into your BI tool, you’ll need to use an ETL tool or a connector. For example, to move data from Zendesk to Metabase, we use use Stitch for ETL. You can find an open source or low cost ETL tool to add yourself, or work with your engineering team to implement a more robust data pipeline. Zendesk also offers apps, which allow you to connect directly to certain BI tools, like Tableau.
We also use a reverse ETL tool called Census. Building a pipeline with reverse ETL tooling can help you push organizational data back to your ticketing system, like customer org ID, subscription status, support tier, etc. Pushing org data from your data warehouse to your ticketing software is only necessary if you want that data on hand in the ticketing software when responding to tickets.
4. Create a dashboard with the results
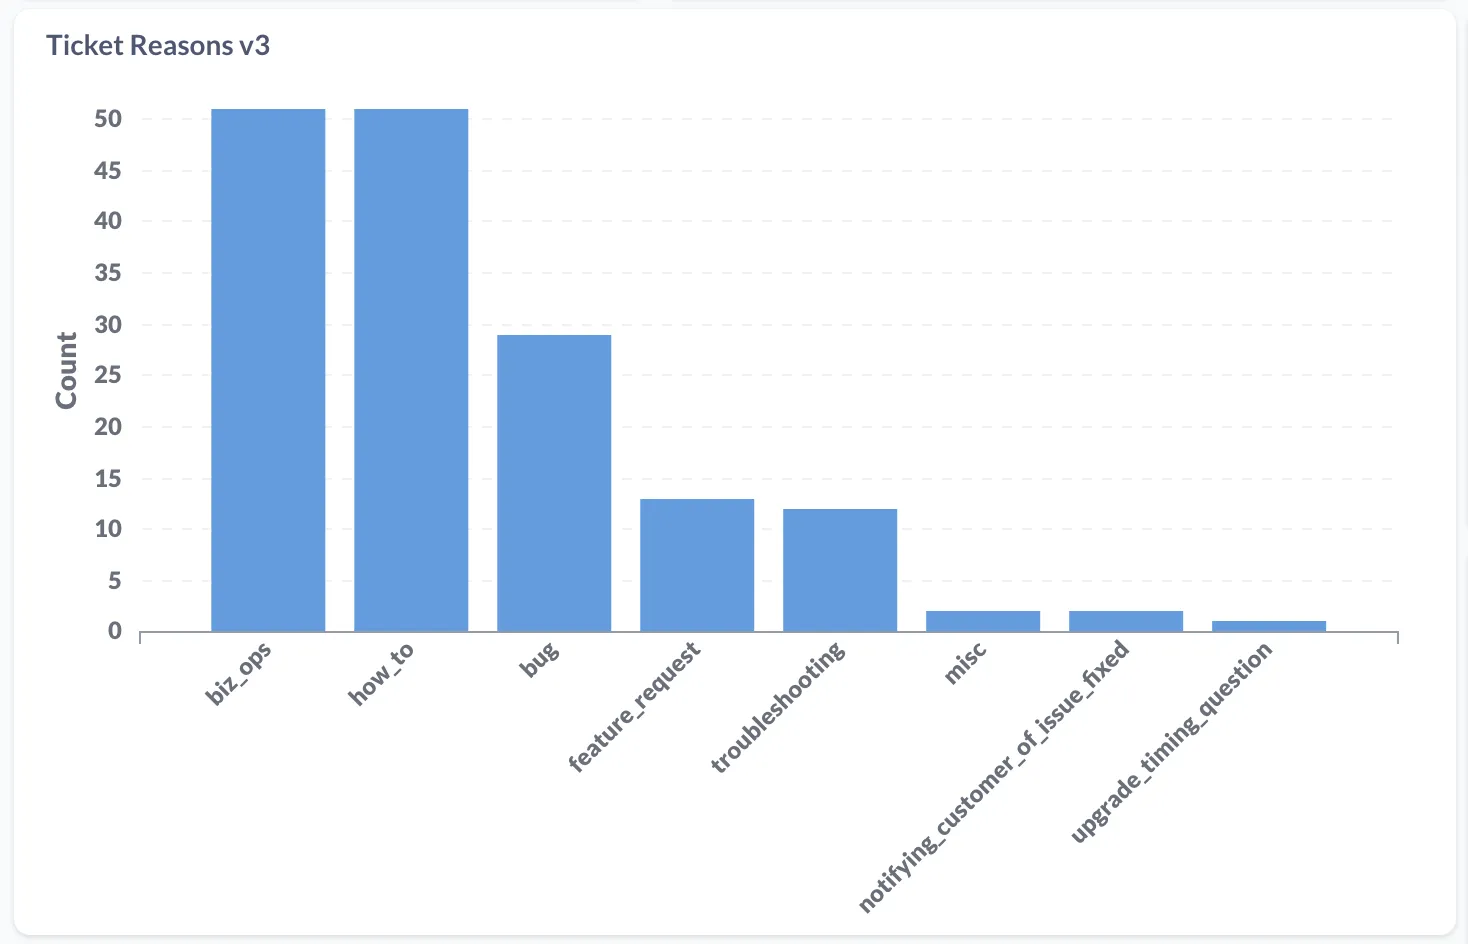
Once your ticket data is flowing into Metabase, or whichever BI tool you’re using, you can start asking questions. For example, you can ask yourself, “What is our most common ticket reason?” or “Which product areas have the most tickets?” These questions will help narrow down which data to focus on, and find the results you’re looking for.
If you’re using Metabase, you can create a new question and add it to a dashboard to find initial insights, and start tracking trends over time.
For example, if you notice a particular ticket reason trending week-over-week, you can click on any point in a chart and select “View these Tickets”. Note: This feature only works with questions built in the query builder, not in native query.
If you’re using Zendesk, ticket type is a default field that you can use to filter ticket data across ticket reason and areas. Some other default fields that may be useful are “status” and “priority”.
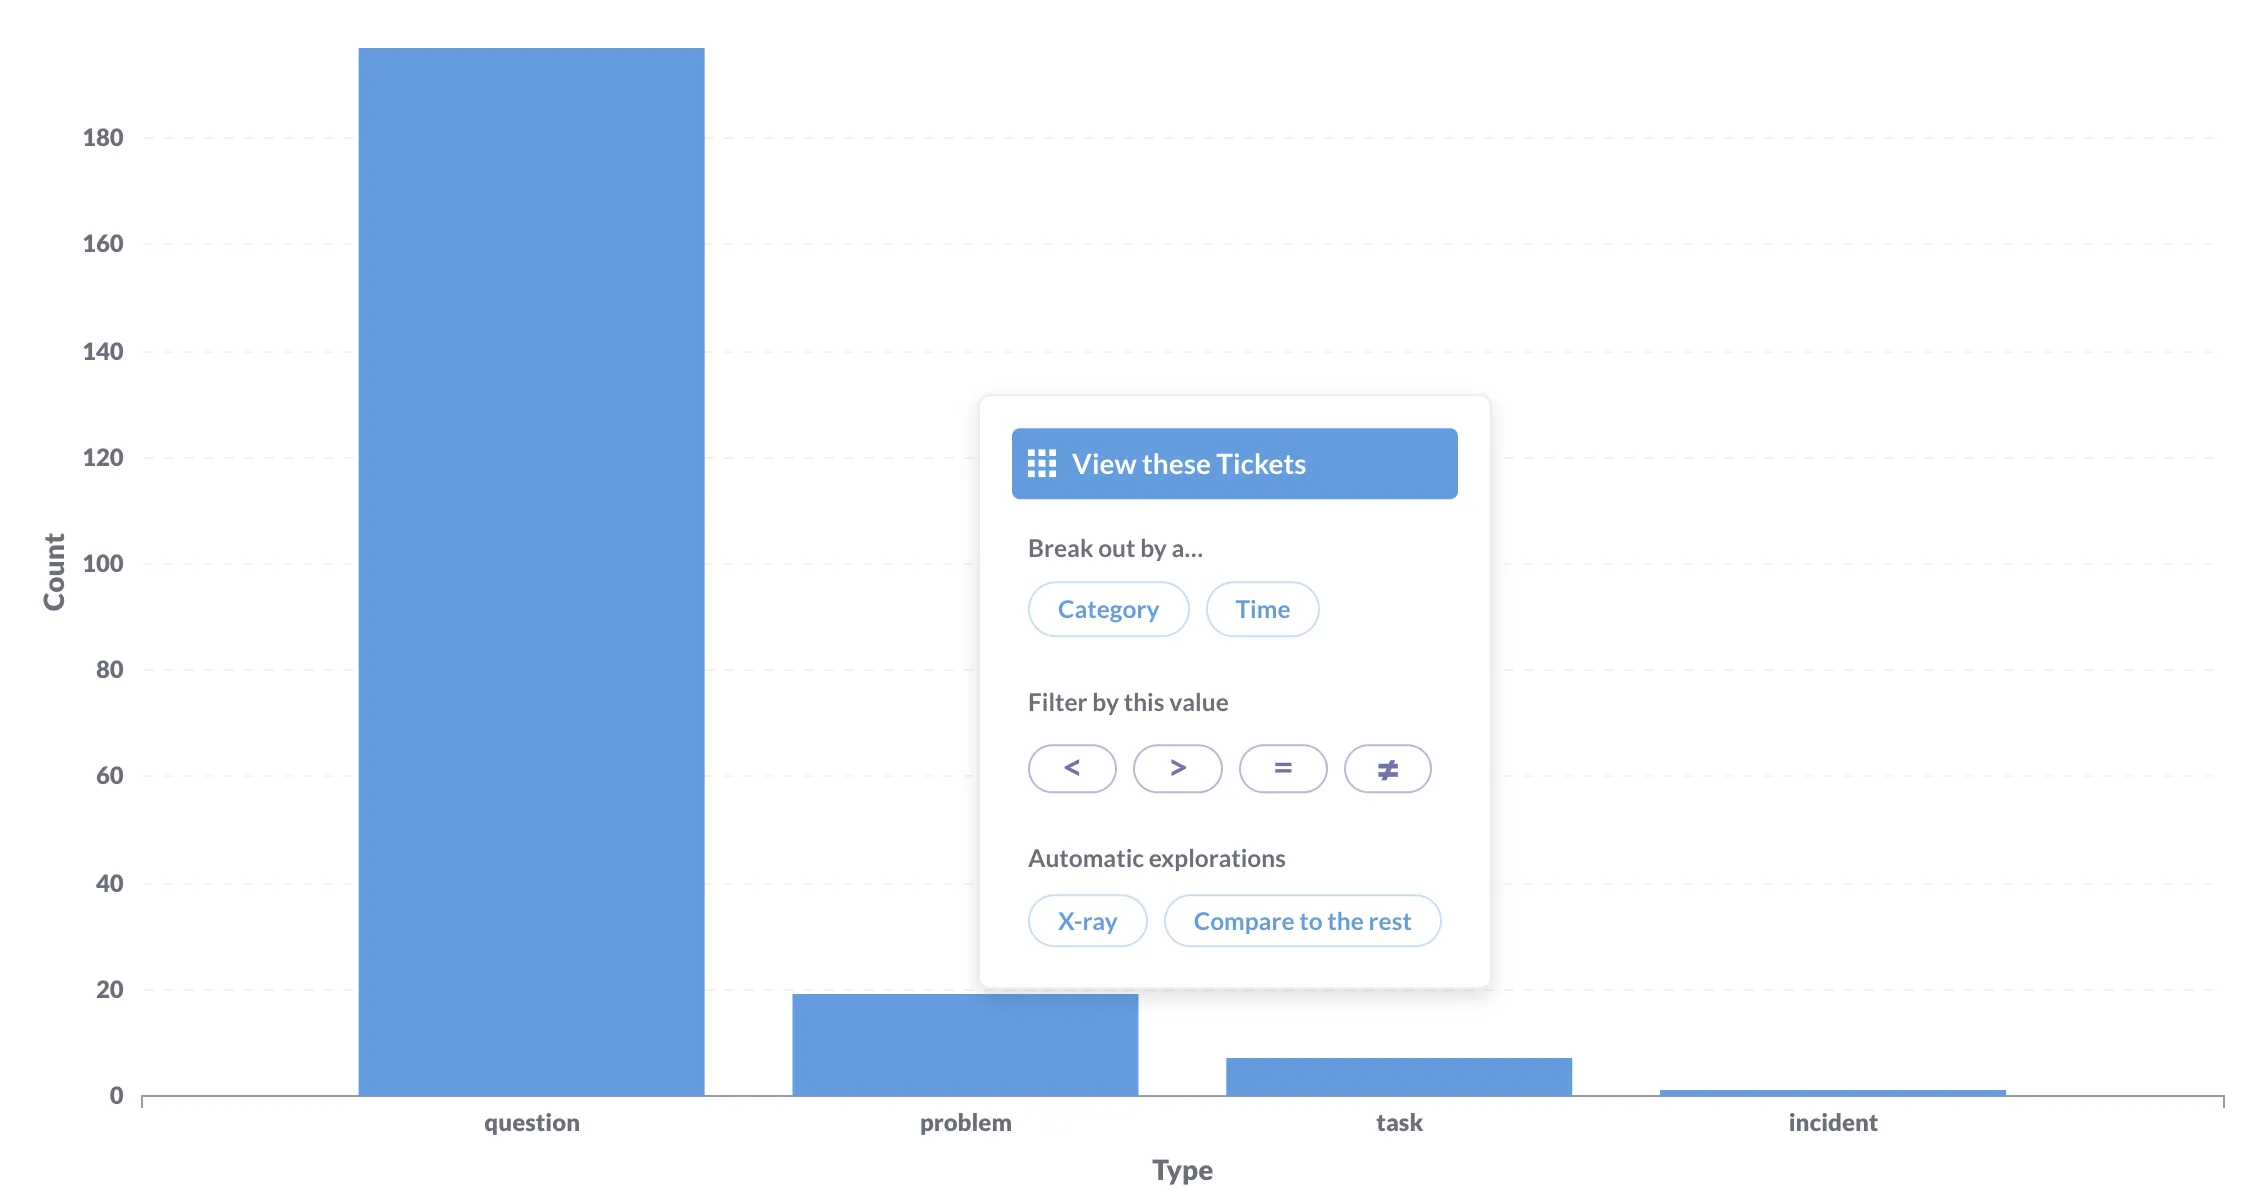
To get an idea of how many tickets are considered problems versus general questions in Metabase, you can drill-through to a specific ticket reason and filter by ticket type. Use the summarize button to summarize tickets by count, and choose to group by type. Sort the tickets in descending order, and visualize as a bar chart.
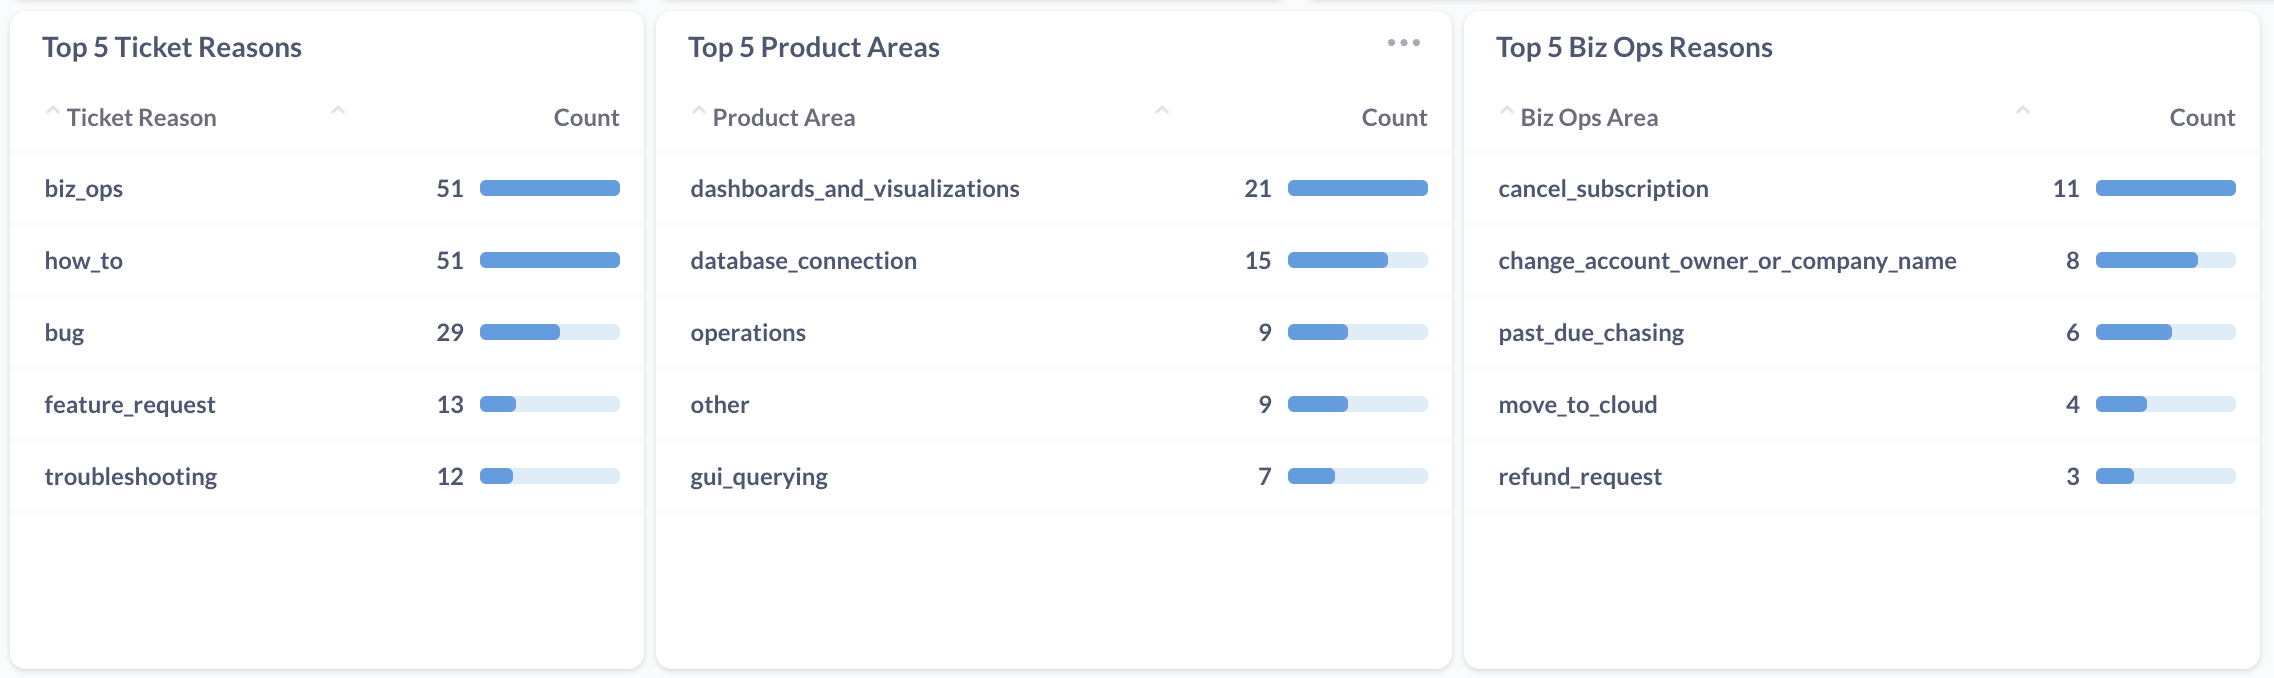
With a support ticketing dashboard, you can also track ticketing trends, like top 5 ticket reasons or areas, and send weekly reports to your team and company. Metabase dashboards allow subscribers, so people can subscribe to your dashboard and get updates directly to their email inbox or in Slack.
You can read the original post to get up to speed in deploying such automated dashboards using Metabase.
