
This post examines some of the available Kubernetes monitoring and Kubernetes logging tools, including Prometheus for monitoring and Grafana for visualization and dashboards. It also explains how Rafay’s Visibility and Monitoring Service enhances your teams’ Kubernetes monitoring ability.
This article was originally published by Rafay.
Kubernetes Ecosystem Tools for Logging and Monitoring
There are a variety of popular tools that can enhance your Kubernetes container monitoring efforts. Some of the most common ones include:
- Prometheus: An open-source event monitoring and alerting tool that collects and stores metrics as time series data. Prometheus joined the Cloud Native Computing Foundationin 2016 as the second hosted project afterKubernetes.
- Grafana: A fully managed visualization platform for applications and infrastructure that works with monitoring software such as Prometheus. Grafana provides capabilities to collect, store, visualize, and alert on data.
- Thanos: A metric system that provides a simple and cost-effective way to centralize and scale Prometheus-based monitoring systems.
- Elasticsearch: A distributed, JSON-based search and analytics engine.
- Logstash: An open source, server-side data processing pipeline that ingests data from a multitude of sources simultaneously, transforms it, and then sends it to your favorite stash.
- Kibana: A data visualization and exploration tool used for log and time-series analytics, application monitoring, and operational intelligence use cases.
Which Kubernetes Monitoring Tools Should You Choose?
Many teams use these monitoring and logging tools alone or in combination to create their own solutions and address specific container monitoring and Kubernetes application monitoring needs. One of the most commonly used combinations is Prometheus plus Grafana. Prometheus enables you to gather time-series data from both hardware and software sources, while Grafana lets you visualize the data that Prometheus collects.
Another popular combination is Elasticsearch plus Logstash plus Kibana, often referred to as ELK stack or Elastic Stack, and all available through Elastic. While Elastic is itself a for-profit company, these components are free and open source.
Implementing any of the above tools, whether singly or in combination, necessarily creates a certain amount of complexity, especially as your Kubernetes fleet grows to include many clusters—potentially running different K8s distributions in different cloud environments.
Managing a Prometheus config at scale may become a challenge due to app onboarding issues, manual configuration requirements, and configuration drift. While Prometheus and Grafana work well together for individual clusters, in multi-cluster environments you may have to add Thanos to your toolset to aggregate data and provide long-term storage and a global view. Still you may face limitations with data retention and HA that cause some to prefer ELK stack.
Because of this complexity, many organizations prefer monitoring as a service using commercial solutions such as Datadog, Cloudwatch, and New Relic.
How Rafay Simplifies Kubernetes Monitoring
The Rafay Visibility and Monitoring Service is a cloud-based service that unifies monitoring, alerting, and visualization for all your Kubernetes clusters and applications, reducing mean time to recovery (MTTR) by up to 60%.
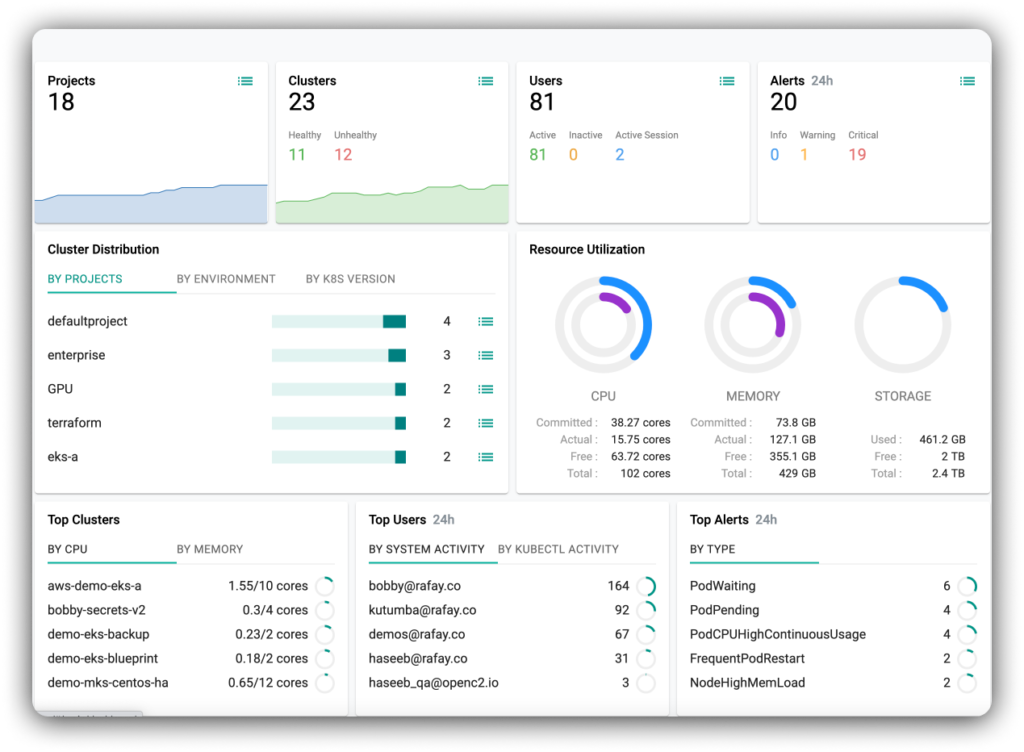
Rafay’s service provides a single pane of glass (SPOG), enabling centralized Kubernetes logging and management for your entire K8s fleet, spanning multi-cluster, multi-cloud, and edge deployments. Contextual, role-based dashboards let your team drill deeper into your K8s environment, providing enterprise-wide insights at a project, cluster, node, application, pod, or container level. From Rafay dashboards, you can see a wide range of Kubernetes metrics and events including resources consumed, user and access activity, critical alerts, and the overall health of every cluster and application deployed. You can instantly visualize, diagnose, and resolve incidents by interactively drilling down and identifying issues quickly.
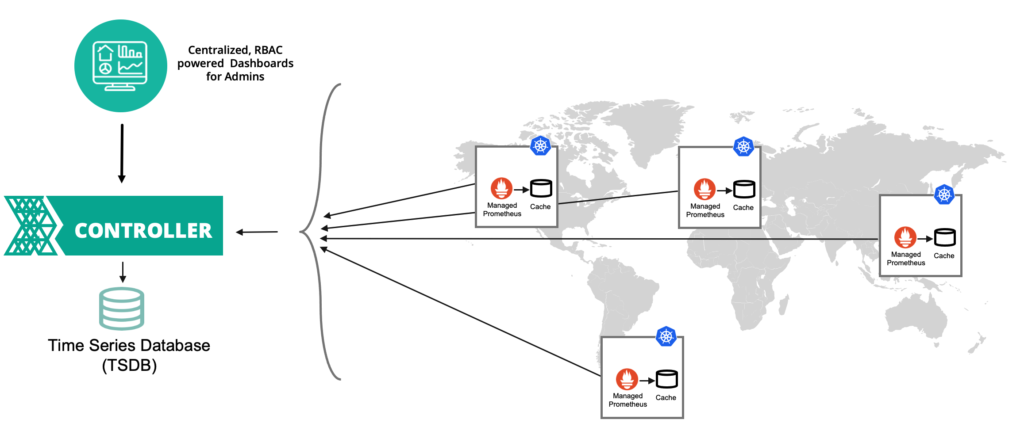
The Rafay Controller provides a web-based view of the entire fleet of Kubernetes clusters under management. When the Visibility and Monitoring Service is enabled, Prometheus and related addons are automatically deployed on your clusters, and metrics are automatically scraped and aggregated to a centralized time series database for all clusters.
Integrate with the Tools You Rely On
Rafay integrates with a variety of popular management tools and services including Amazon Prometheus, CloudWatch, Datadog, Grafana, New Relic, Splunk, and the Prometheus Operator(for custom Prometheus). If you utilize or plan to use these tools, Rafay can standardize the deployment and config of the necessary components.
Streamline Visibility and Monitoring with Rafay
To discover how Rafay can help you standardize visibility and monitoring across your entire fleet of K8s clusters, take a closer look at Rafay’s Visibility and Monitoring Service. Rafay’s Kubernetes Operations Platform delivers the visibility, monitoring, and other capabilities you need to ensure the success of your multi-cloud, multi-cluster Kubernetes environment.
