
This post covers a UI template with which anyone can create a customizable NFT dashboard. It can pull granular, historical NFT data from multiple blockchains including Ethereum, Polygon, Avalanche and many others, with the help of Covalent APIs.
The post was originally published in Covalent
Check out the video below on how to get started and create your own NFT collection dashboard in just 5 minutes!
Covalent’s NFT Dashboard Template
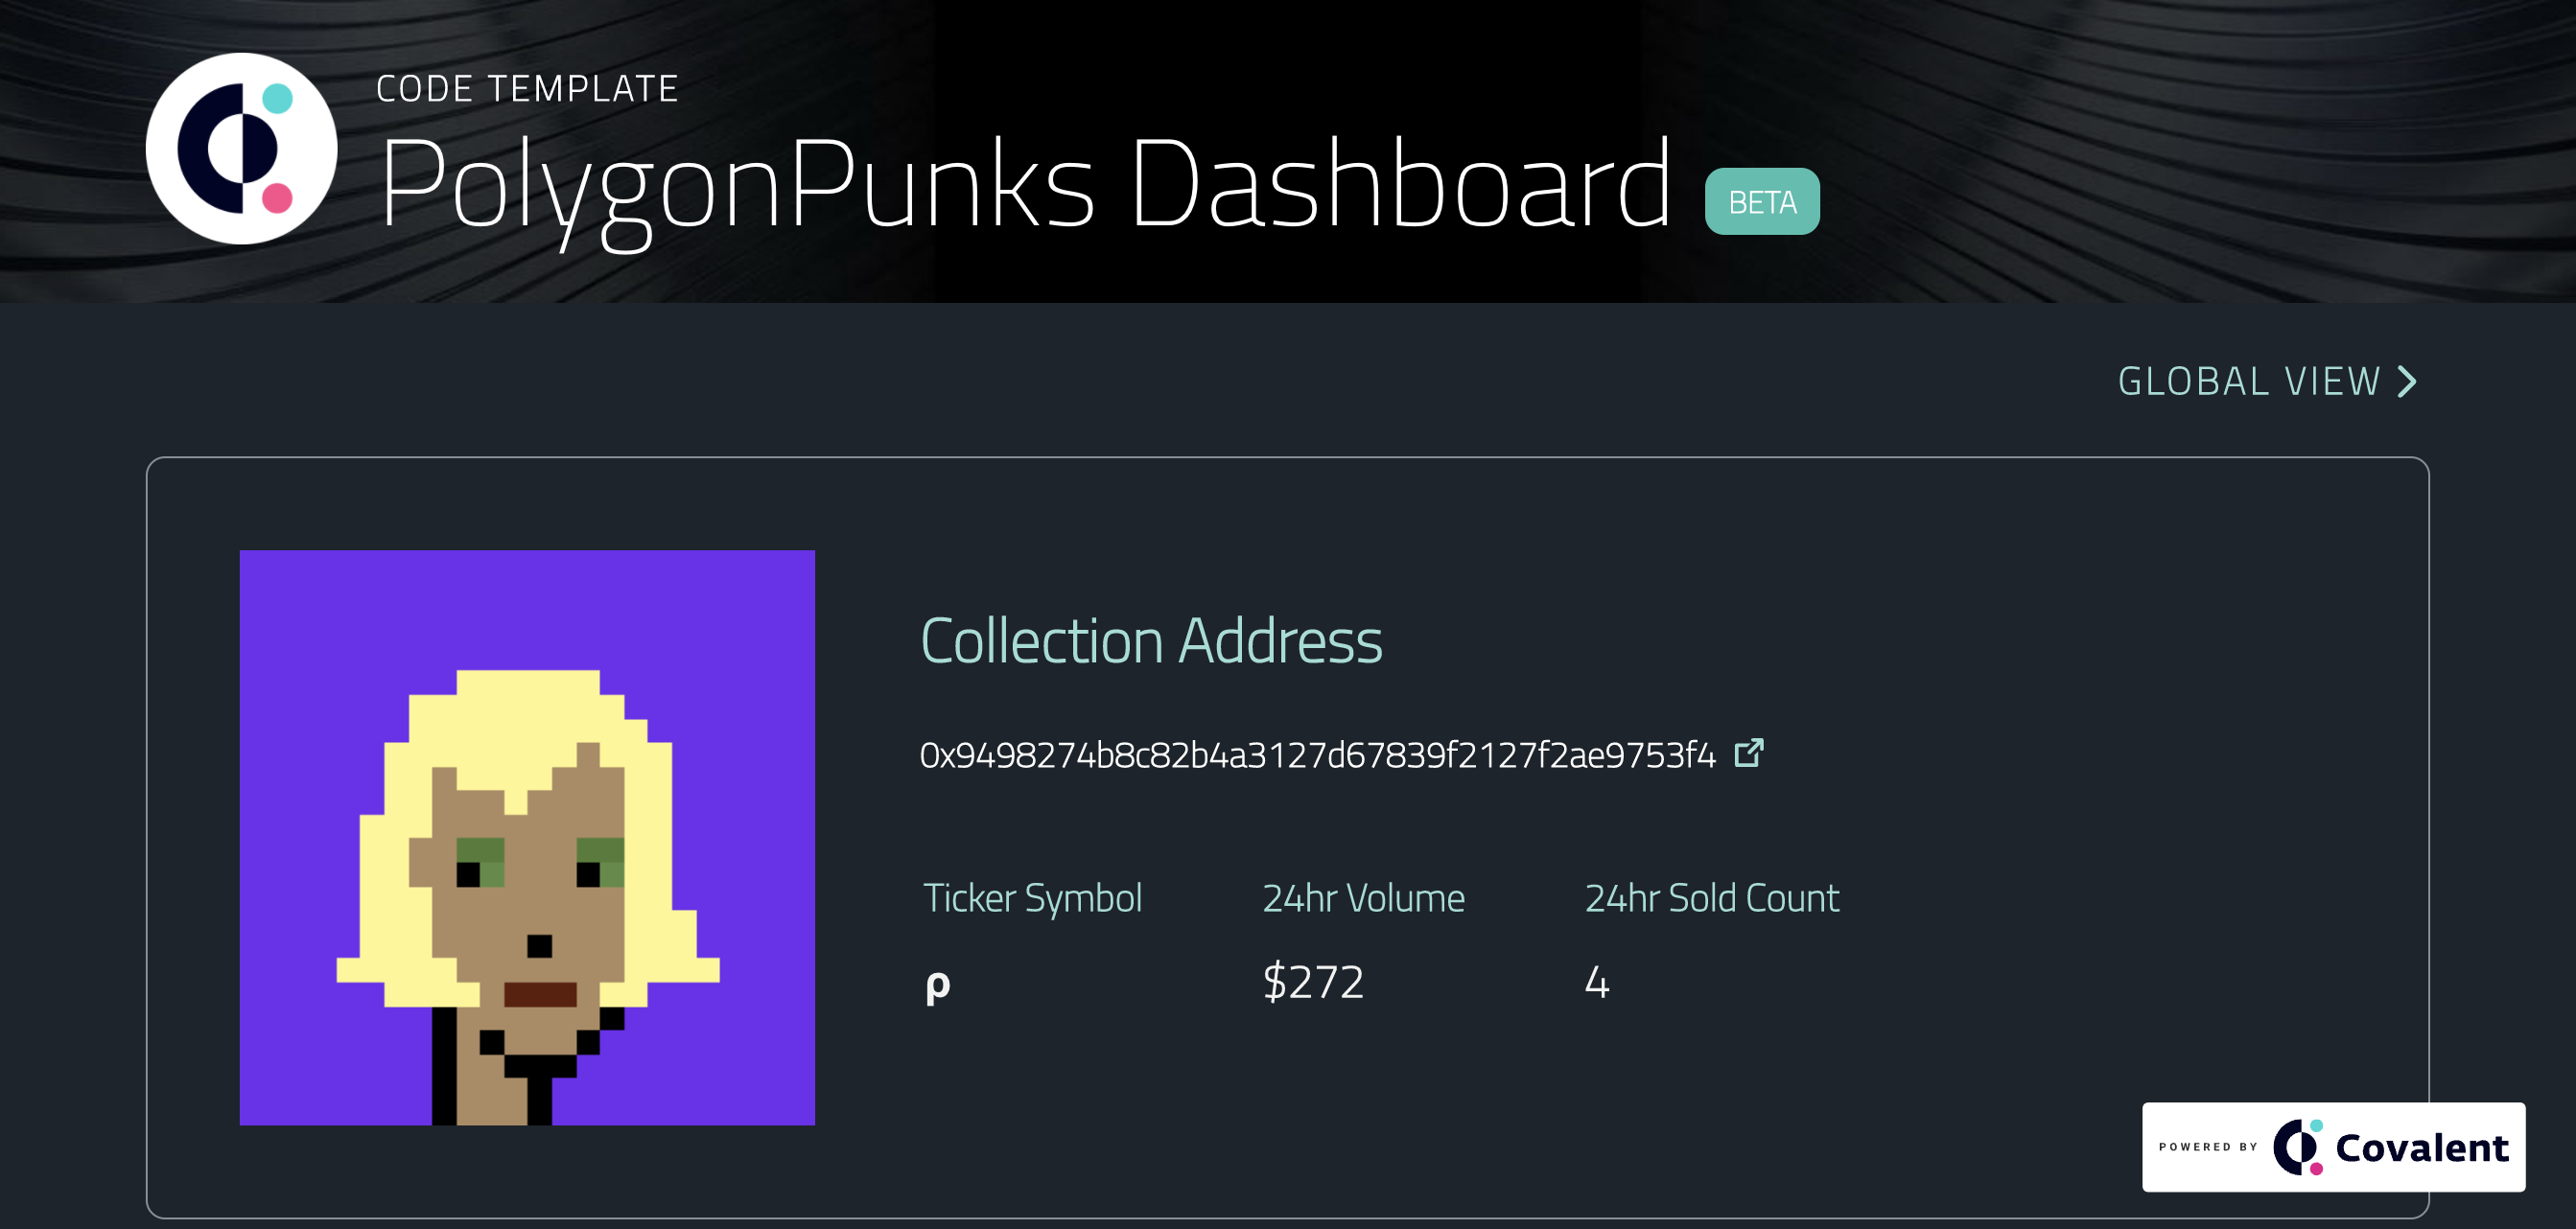
This is a tool for creators and developers to build their own NFT collection dashboards with no-code in only a few quick steps. By default, the dashboard shows the following for any collection:
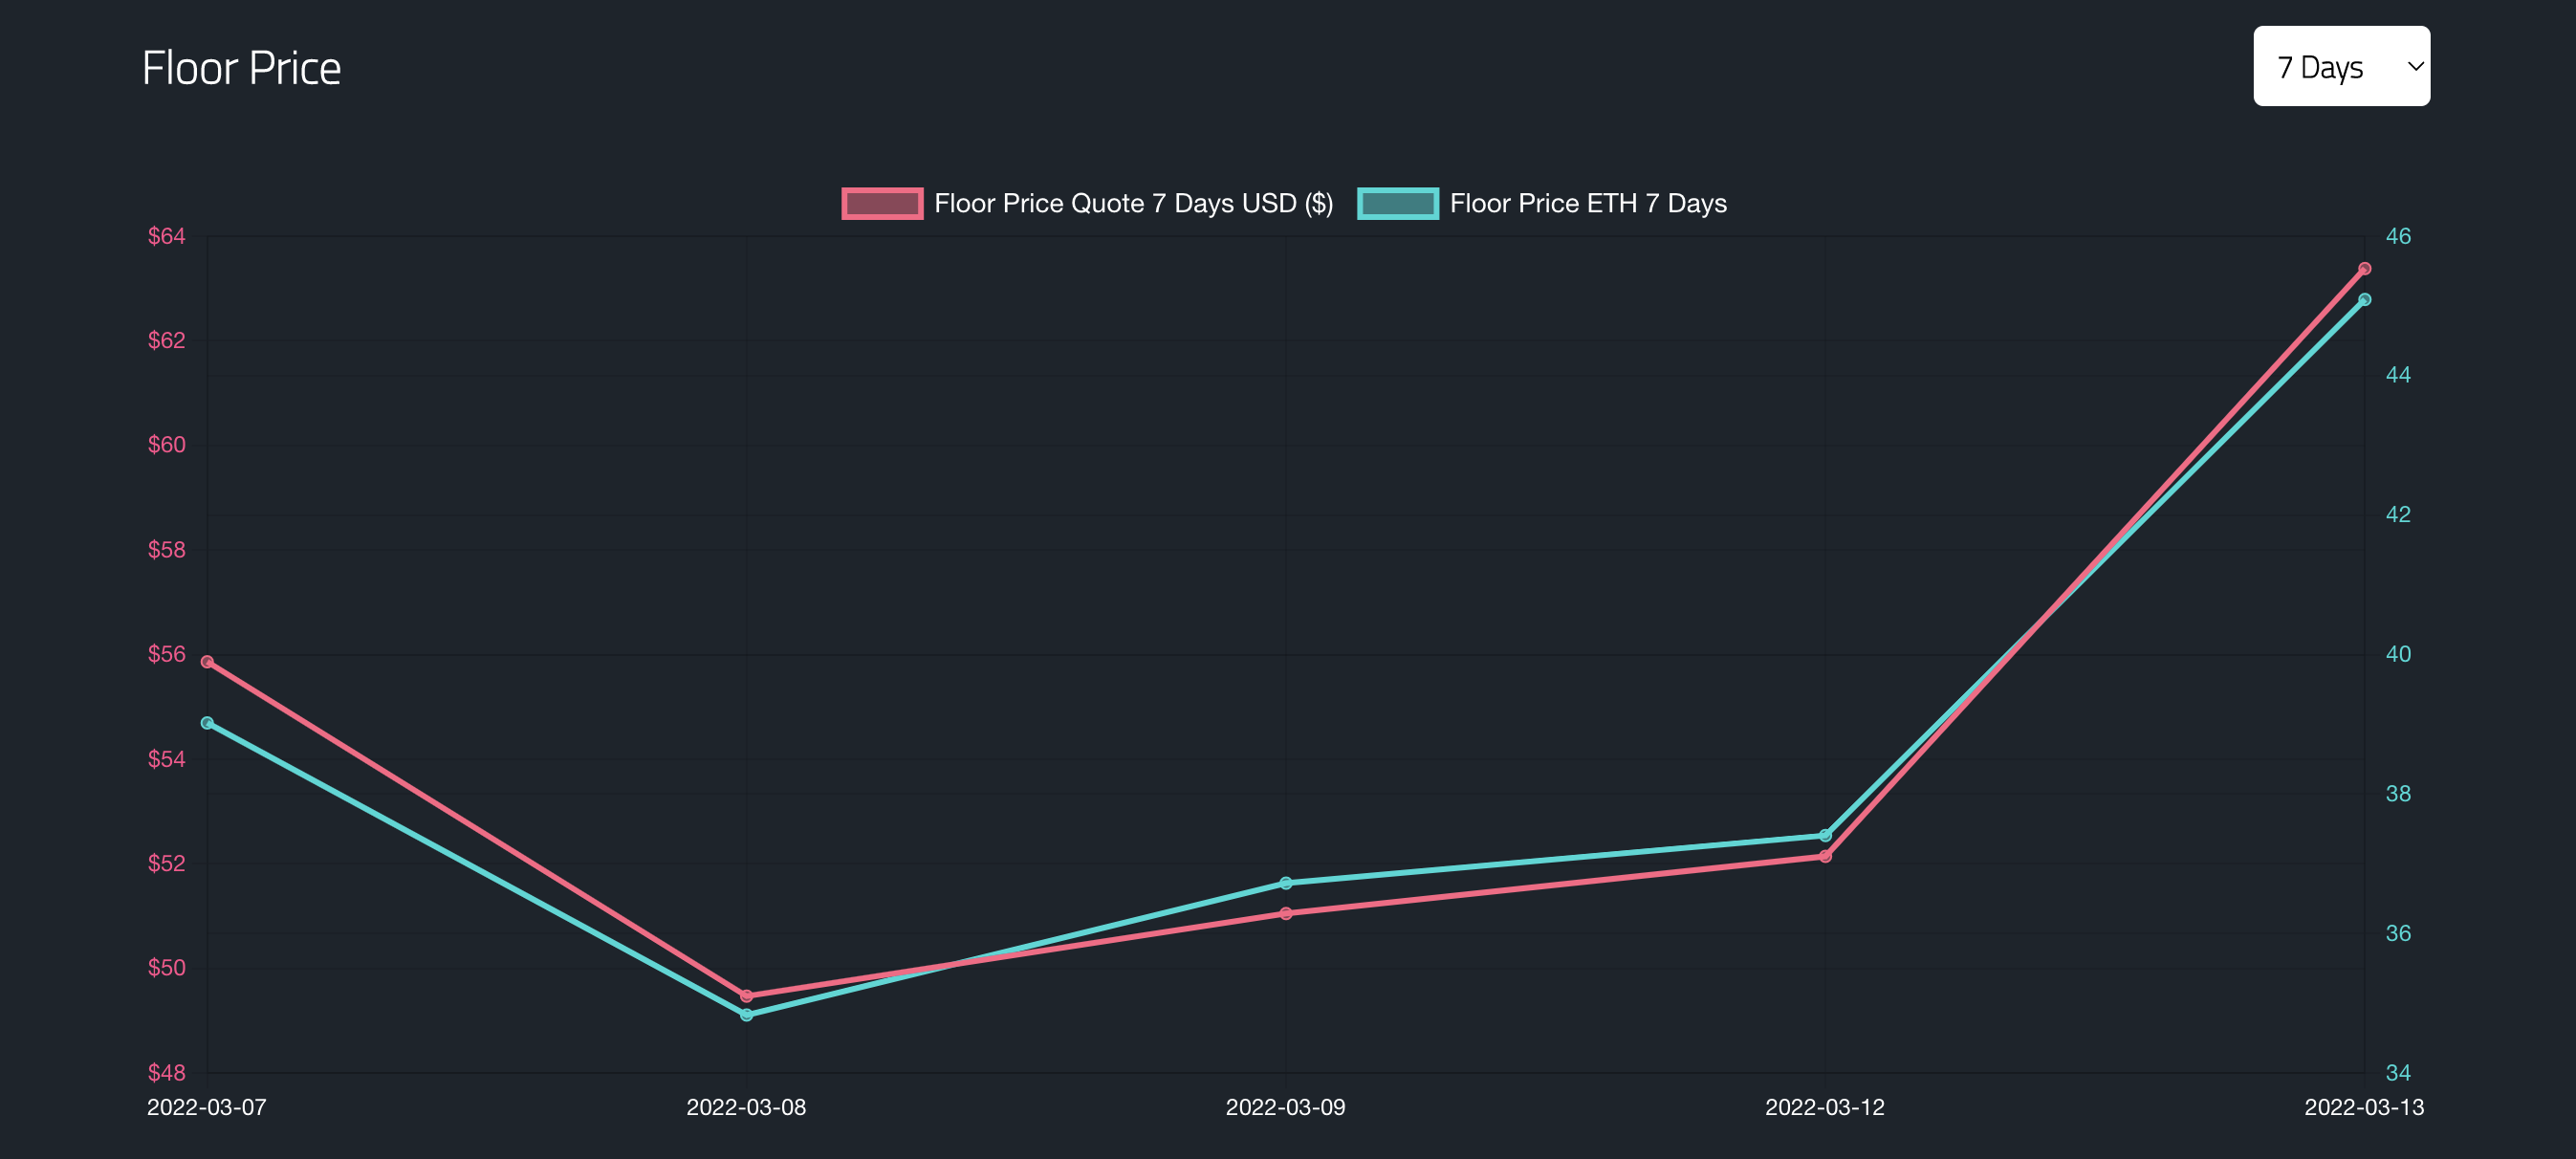
- Historical floor prices
- 24-hour on-chain trading volume
- 24-hour sold count
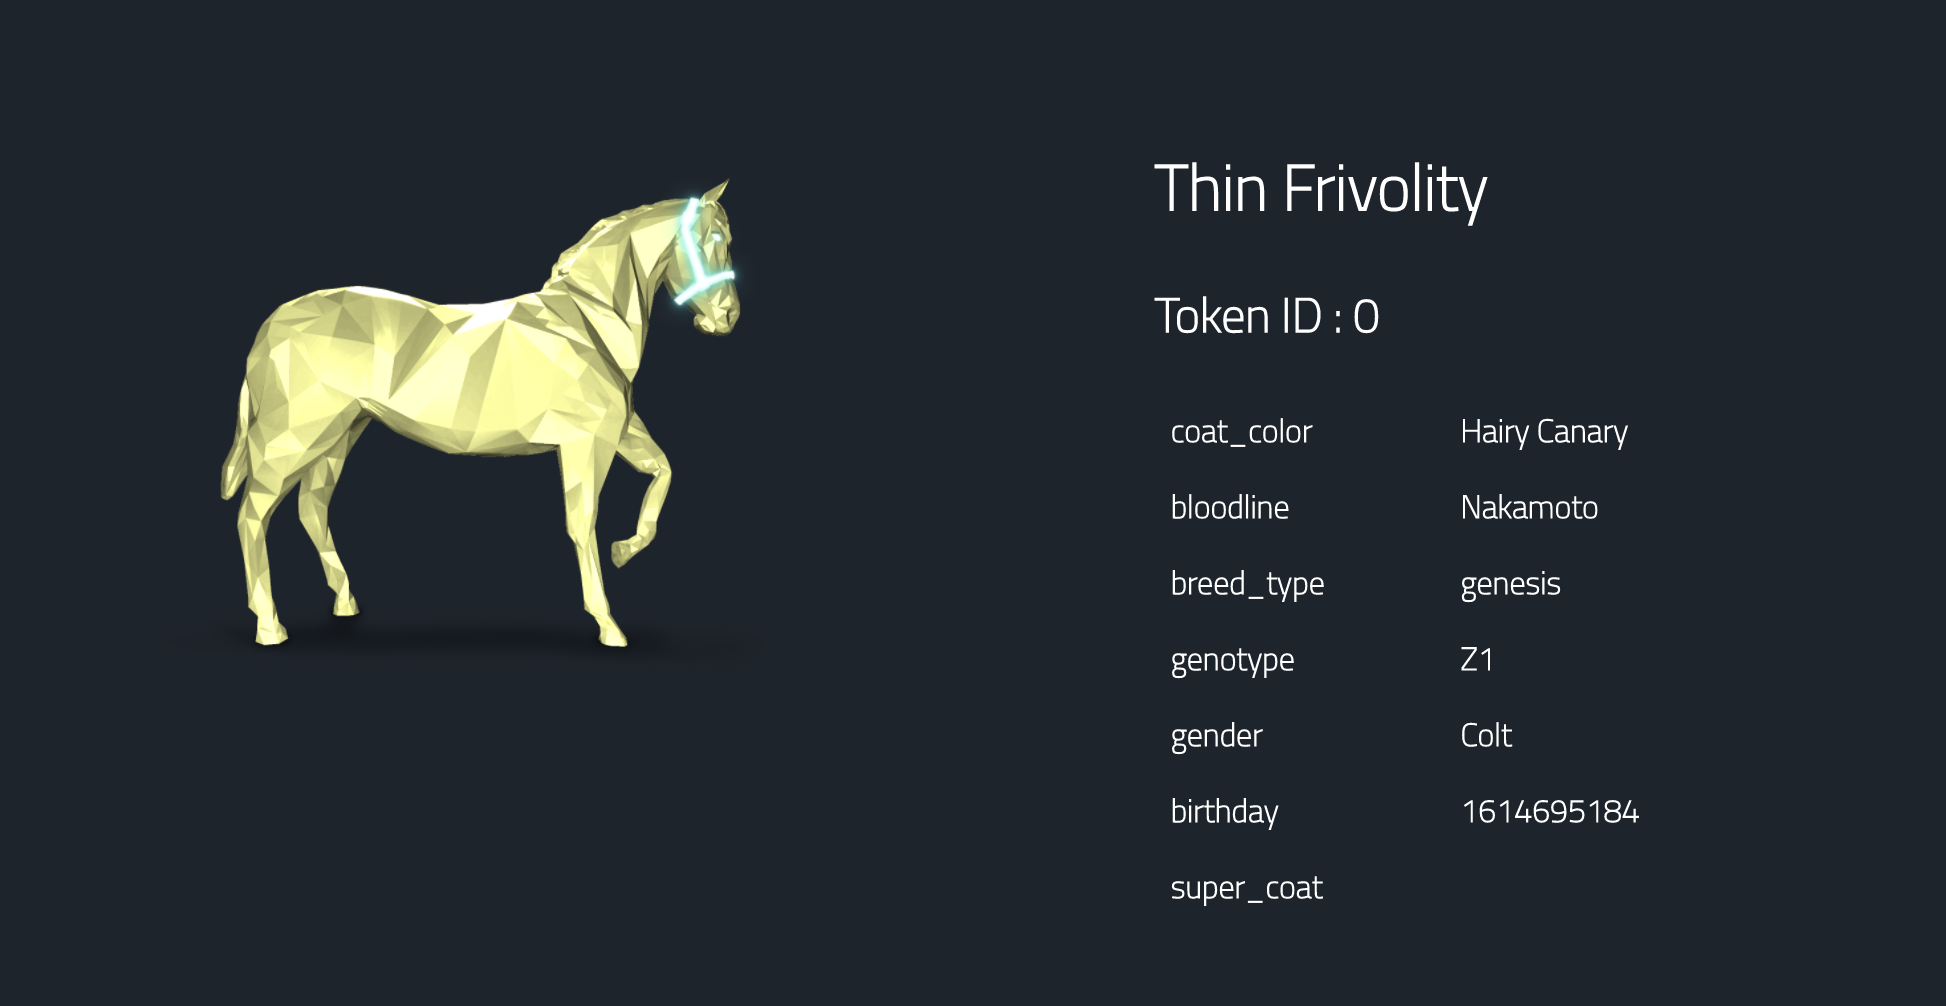
- Preview of the first 5 NFTs with all their metadata
The template makes use of Covalent’s leading NFT APIs:
Get historical data for NFT collectionGet NFT market global viewGet NFT external metadata for contract
To get started, go to the NFT Dashboard template repo on GitHub and follow the detailed README or the video tutorial above.
Supported:
| Chain | Markets |
|---|---|
| Ethereum | OpenSea, Rarible, Foundation, Refinable, NFTrade, LooksRare, CryptoPunks |
| Polygon | OpenSea, Refinable, NFTrade |
| Avalanche | TofuNFT, NFTrade |
| Fantom | Artion, TofuNFT |
| Arbitrum | Treasure, TofuNFT |
| Shiden | TofuNFT |
| Moonbeam | TofuNFT |
| Moonriver | TofuNFT, NFTrade |
Diving Into NFT Data
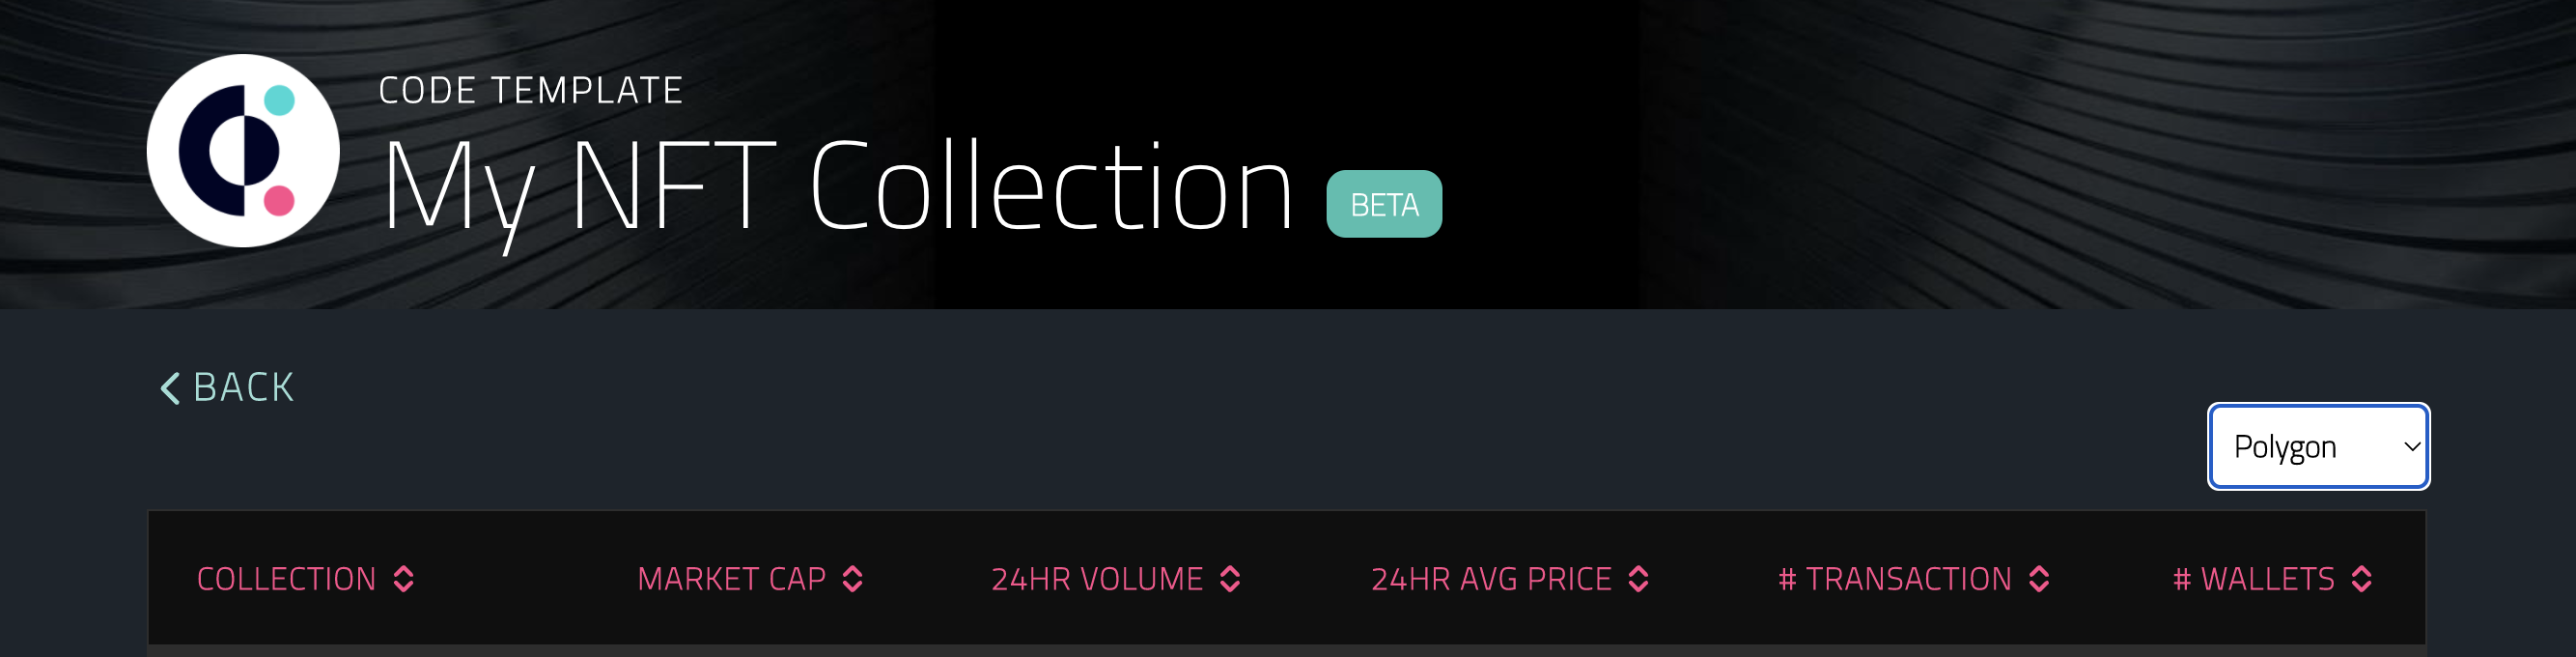
The NFT space is dominated by large marketplaces primarily on Ethereum and Polygon. However, Web3 is full of interesting NFT communities that aren’t just on those protocols. Emerging collections on chains like Avalanche, Fantom and Arbitrum for example, might be harder to find for the curious collector who wants to branch out. The Global View page of the NFT dashboard template returns a comprehensive list of every collection on a selected blockchain, ranked by market cap (by default).
For a particular collection, the NFT dashboard displays a historical floor price chart in USD and the blockchains’ native gas token (e.g. ETH, MATIC). This is a great way to analyze NFT trends outside all the noise of crypto twitter! Clicking on any of the individual NFT previews provides the metadata and rarity attributes.
There are many solutions to access NFT data, but none that can efficiently aggregate market data across different NFT marketplaces and blockchains and standardize the response like the Covalent API. For more details aboutour NFT APIs.
What’s Special About Covalent?
To aggregate NFT data without Covalent’s unified blockchain API would require piecing together different tools, response formats, APIs and simply cost developers more time and money and serve as a barrier to entry.
How Does the API Add Value to the Covalent Network?
The Covalent Network connects the supply side, which are the blockchains we index, and the demand side made up of developers, analysts, and applications.
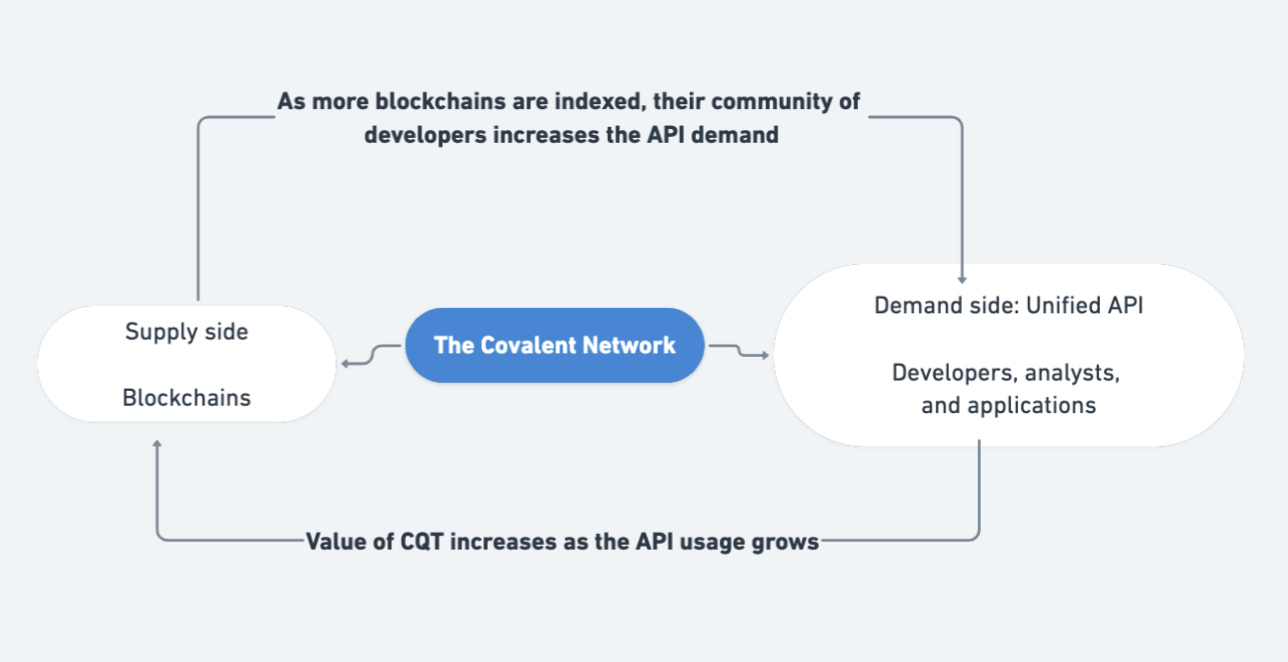
API usage is important for us not only because it means we are expanding our community, but it also benefits the health of the Covalent Network. For holders of our Covalent Query Token (CQT), demand-side traction contributes to the value accrual of the token.
So how will developers impact the token value in the future? Let’s take the example below.
Mary is a developer who integrates the Covalent API endpoint “Get NFT Market Global View” and she buys $10 USDC worth of data. Every time she uses the API to get blockchain data, she pays a fee in a US-denominated stablecoin like USDC. Then the smart contract on the network will automatically perform a market buy of CQT and a portion of CQT is given to node operators in our network who answer the API request. As the use of these API calls grows, this increases the value of the network and CQT.
