
With the data and analytics industry embracing graph analytics, its no surprise that major corporations are deploying large-scale graphs to gain greater insights from their data. As interest, use cases, and deployments have grown, the field has matured so that it now makes sense to talk about Graph Data management.
This post was originally published in TigerGraph.
Graph Data Science
What is Graph Data Science? The simple answer is that it is the branch of data science which employs graph data structures and graph analytical techniques. It includes data modeling and data management, as well analytical methods ranging from simple statistics-gathering queries, to algorithms which reveal more complex patterns, to machine learning methods which form predictive models.
TigerGraph has been a leader in graph data management with its real-time scalable graph database, and graph algorithms have been part of TigerGraph’s DNA since our start. We used to call our collection of algorithms the GSQL Graph Algorithm Library, GSQL being our analytics-friendly query language. Recently, as part of a major initiative to deliver out-of-the-box Graph Data Science and Graph Machine Learning, we decided to fine-tune the algorithm library. To signal this change, we’ve renamed it the Graph Data Science Library.
Graph Data Management with TIgerGraph’s Library
TigerGraph’s Graph Data Science Library v1.0 contains several great improvements and additions, but it’s only the start. The most obvious change is the addition of over 20 new algorithms, bringing the total to over 50, including some new categories of algorithms. Here’s a summary of what’s new:
- Library collection: 20+ new algorithms, including embedding algorithms for graph ML.
- Library structure and management: Our library continues to be open-source, on GitHub. We’ve improved the organization, grouping algorithms by category, and placing each algorithm in its own folder with a README and Change Log file. The repository will use tags to identify major releases.
Let’s take a close look at the new algorithms and their use cases:
Graph Embeddings
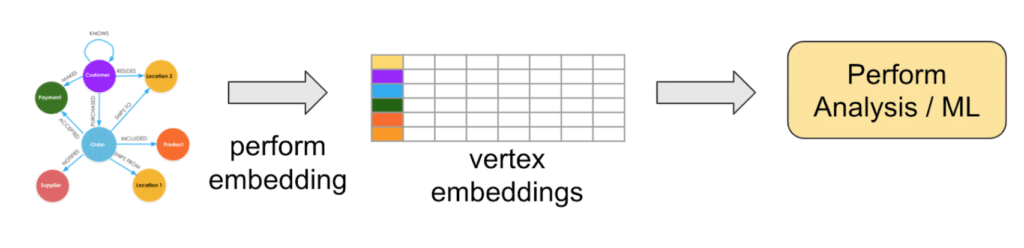
Embedding (verb) is transforming high-dimensional data to a lower-dimensional representation, while accurately preserving the most important features. An embedding (noun) is one of those lower-dimensional representations. An example is a 2-D map of our 3-D planet surface. Graphs are high-dimensional, with each type of relationship representing another dimension. This high-dimensionality is part of the reason that they are so good at describing complex relationships. Alas, traditional machine learning techniques are designed to work with low-dimensional tabular or matrix data. Enter graph embedding!
Graph embedding algorithms (strictly speaking, node embedding algorithms) transform a network of interconnected vertices into a set of independent embedding vectors, one for each vertex. The edge connections are dropped. However, vertices which have similar neighborhoods in the original graph will have similar embedding vectors. So, you can easily perform similarity and clustering with the vertex embeddings, which can in turn be used to train a model to predict classifications.
TigerGraph’s Graph Data Science Library includes two popular graph embedding algorithms, node2vec and FastRP. Node2vec is known for producing accurate embeddings, but it can be slow on larger graphs. As its name suggests, FastRP runs (much) faster, at the cost of some accuracy.
Other New Algorithms
Centrality algorithms help to identify which entity is the most influential or impactful. Different centrality algorithms frame the question in different ways, so having a good selection of algorithms to choose from means you are ready to handle more situations. We expanded our collection by adding Article Rank, Eigenvector Centrality, Degree Centrality, and Influence Maximization.
Community algorithms are one of our most popular types of algorithms, because they are often used in anti-fraud, personalized recommendation, and for detecting social groups. They perform the complex task of judging exactly which set of neighboring vertices should be considered a “community” because they have a relatively high degree of in-group connections. We added Speaker-Listener Label Propagation which supports the important case of overlapping communities. We also improved the performance or added two variants of our existing community algorithms.
Similarity algorithms are also incredibly useful, for recommendation and classification tasks. We added four new algorithms: Approximate Nearest Neighbors, Euclidean Similarity, Overlap Similarity, and Pearson Similarity.
We introduced a new category: Topological Link Prediction. This category could also be called Structural Similarity. While these algorithms are fairly simple, they nevertheless help to round out our offerings. We added measurement algorithms for Adamic Adar, Common Neighbors, Preferential Attachment, Resource Allocation, Same Community, and Total Neighbors.
Last but not least, we added A* and Random Walk path algorithms. A* (pronounced “A star”) estimates the total cost to reach a destination or goal, if you have completed part of the journey and then have a heuristic for estimating the remaining cost based on your present position.
Continuing the TigerGraph Way
While adding improvements, we’re maintaining three principles that have set us apart: open-source, in-database, and scalable high-performance. Together, they form a user-oriented experience.
Open-source: TigerGraph’s algorithms are open to the community to critique and to offer suggested improvements. It also means that you can customize the algorithms as you like. This has been one of our most appreciated features. You aren’t locked into the default functionality. You can tweak input parameters, filtering, and output formatting. Share your improvements and additions with the rest of the developer community. Email us at [email protected] or make a Git pull request.
Our algorithms are written in GSQL. GSQL has been called the PL/SQL of graph databases: procedural querying. Take the most well-known and successful database query language – SQL, adapt it for graph traversal, add support for procedures like looping, conditional statements, variables and parameters, and then wrap it in a named procedure which you can store and invoke whenever you want: That’s GSQL. Oh, and accumulators and parallel processing! The TigerGraph engine loves to speed up your work through massive parallelism. GSQL accumulators make it easy to traverse and aggregate in parallel.
GSQL is also extensible via user-defined functions (UDFs). Is there a specialized function you need which is tricky to implement using GSQL or is not supported? Then you can write a custom function in C++. A few of the graph data science algorithms employ UDFs.
In-database: Yes, TigerGraph is a database! There are some products out there that are graph analytics or graph visualization tools, but they aren’t designed for managing data or handling transactions the way that TigerGraph is. We are an enterprise distributed in-memory database, so we handle a wide range of operational and analytics use cases. One of our advantages is the ability to handle multiple types of workloads on the same platform. Being able to run graph algorithms within the updatable database means that you are analyzing the latest data, with no need to export to a separately managed copy, and that you can even update the database based on the results of your algorithms.
Scalable: TigerGraph can grow with your needs. No matter how big or small your current set of data is, it’s likely to grow. TigerGraph is built with a distributed database architecture, with massively parallel processing.
What’s Coming?
The Graph Data Science Library will continue to grow and improve, but it represents only one part of TigerGraph’s vision for delivering high-performance and easy-to-use Graph Data Science and Machine Learning to everyone. Graph embedding algorithms like node2vec and FastRP are one way to take advantage of graph insight to develop more accurate and powerful machine learning. However, since they transform the graph to linear data, we are still losing something.
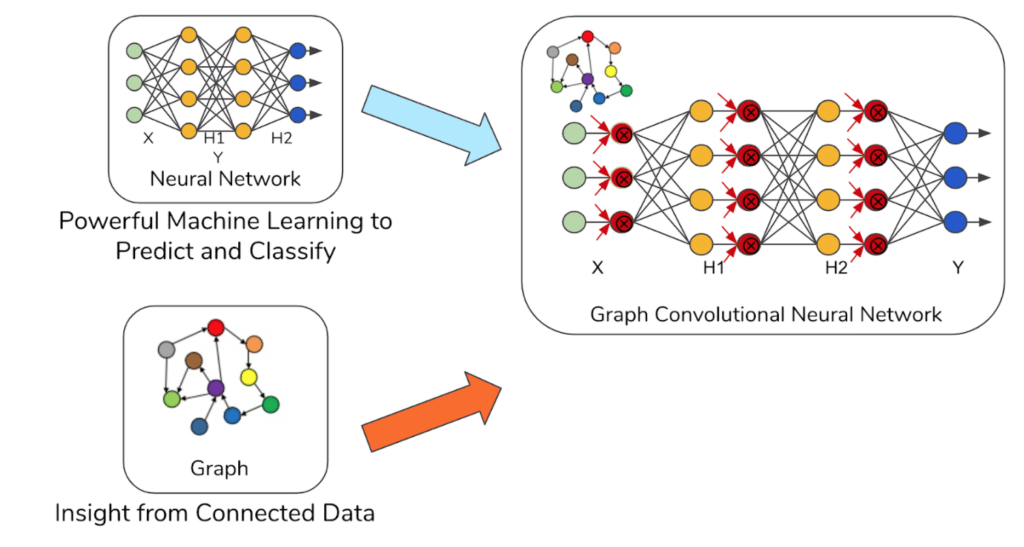
Graph neural networks (GNNs) represent what is arguably the ultimate integration of connected data analytics and machine learning, using the graph structure during the training process itself. The GCN research paper by Kipf and Welling that paved the way is only five years old, but it has transformed the way that data scientists think about graphs. Many other versions of GNNs have followed and are now supported in two major open-source libraries, PyTorch Geometric and DGL
The good news is that you can build a pipeline today, with TigerGraph as a data source, export data with the help of PyTigerGraph or our REST APIs, and train your model with a GNN running on your favorite platform. But it gets better. We are close to delivering the TigerGraph Graph+ML Integrated Workbench.
Imagine a Jupyter-style data science platform that includes the key stages for model development – for graph data and graph machine learning! Prepare your data in TigerGraph, transport it seamlessly to your training environment, select from your choice of graph ML models, train and tune.
Our customers have asked for in-database neural networks, to complement our current in-database algorithms, and we’ve listened. We are planning to deliver in-database ML training in the first half of 2022. In-database training simplifies your pipeline, saving the time and cost of exporting data and running another system.
