
As data has grown exponentially, data quality monitoring has become crucial for building successful data and machine learning systems. 42% of data analysts that took part in Forrester’s Online Global Survey on Data Quality and Trust spend more than 40% of their time vetting and validating the data. In terms of cost, Gartner’s research found that organizations believe poor data quality to be responsible for an average of $15 million per year in losses.
This article was originally published by WhyLabs.
How do you know your data pipelines are working if you manage and deploy them in your data system? Do you check to see if the correct data is getting through? Do you keep track of your data uptime? Do you continuously validate them? And if you do, does your validation account for errors you could not anticipate?
If you have built machine learning models, you know that ML is not a magic wand–your data needs to be fit for the objective of the ML project and have high internal integrity. Therefore, ensuring that high-quality data feeds into your training pipeline from upstream data systems is crucial for the entire project’s success.
Neglecting continuous monitoring does not scale anymore because the data quality is likely to degrade your application before it is triaged and troubleshot, which, of course, could lead to business damages. These damages include poor application performance, regulatory and compliance issues, customer churn, and even considerable revenue loss.
In the first article in this series, you will get a comprehensive overview of data quality monitoring and how you can approach continuously monitoring the quality of your data.
What is Data Quality?
This guide uses data quality to mean the health of your data as it flows through the entire data system. Issues can impact the quality of your data at any stage in the data lifecycle. For instance, it could happen at the ingestion layer while the data flows through the pipeline and even during analysis.
From a technical perspective, high-quality data is of good value for the consumer (service, application, or user that will consume the data) and the business. Ensuring the data ingested into our pipeline is trustworthy and meets required standards is up to a data engineer.
So what does it mean for the data to be “good” or “healthy”? For data to be of good quality, it must be both fit for the business purpose based on the requirements and have high internal integrity to meet the business expectations. Several other dimensions could also define data quality.
What is Data Quality Monitoring?
Monitoring data quality is about measuring, analyzing, and improving data quality to fit the business purposes and meet business expectations.
With the explosion of real-time machine learning and business intelligence, the only approach to successfully validate dynamic data is to monitor its quality continually and evaluate it using a set of relevant quality metrics.
Why do You Need to Monitor the Quality of Your Data?
To understand why you need to monitor the quality of your data, you need to know where data quality issues could stem from in the entire data lifecycle and the types of issues you’ll likely find at each stage.
Where Data Quality Issues Could Stem From
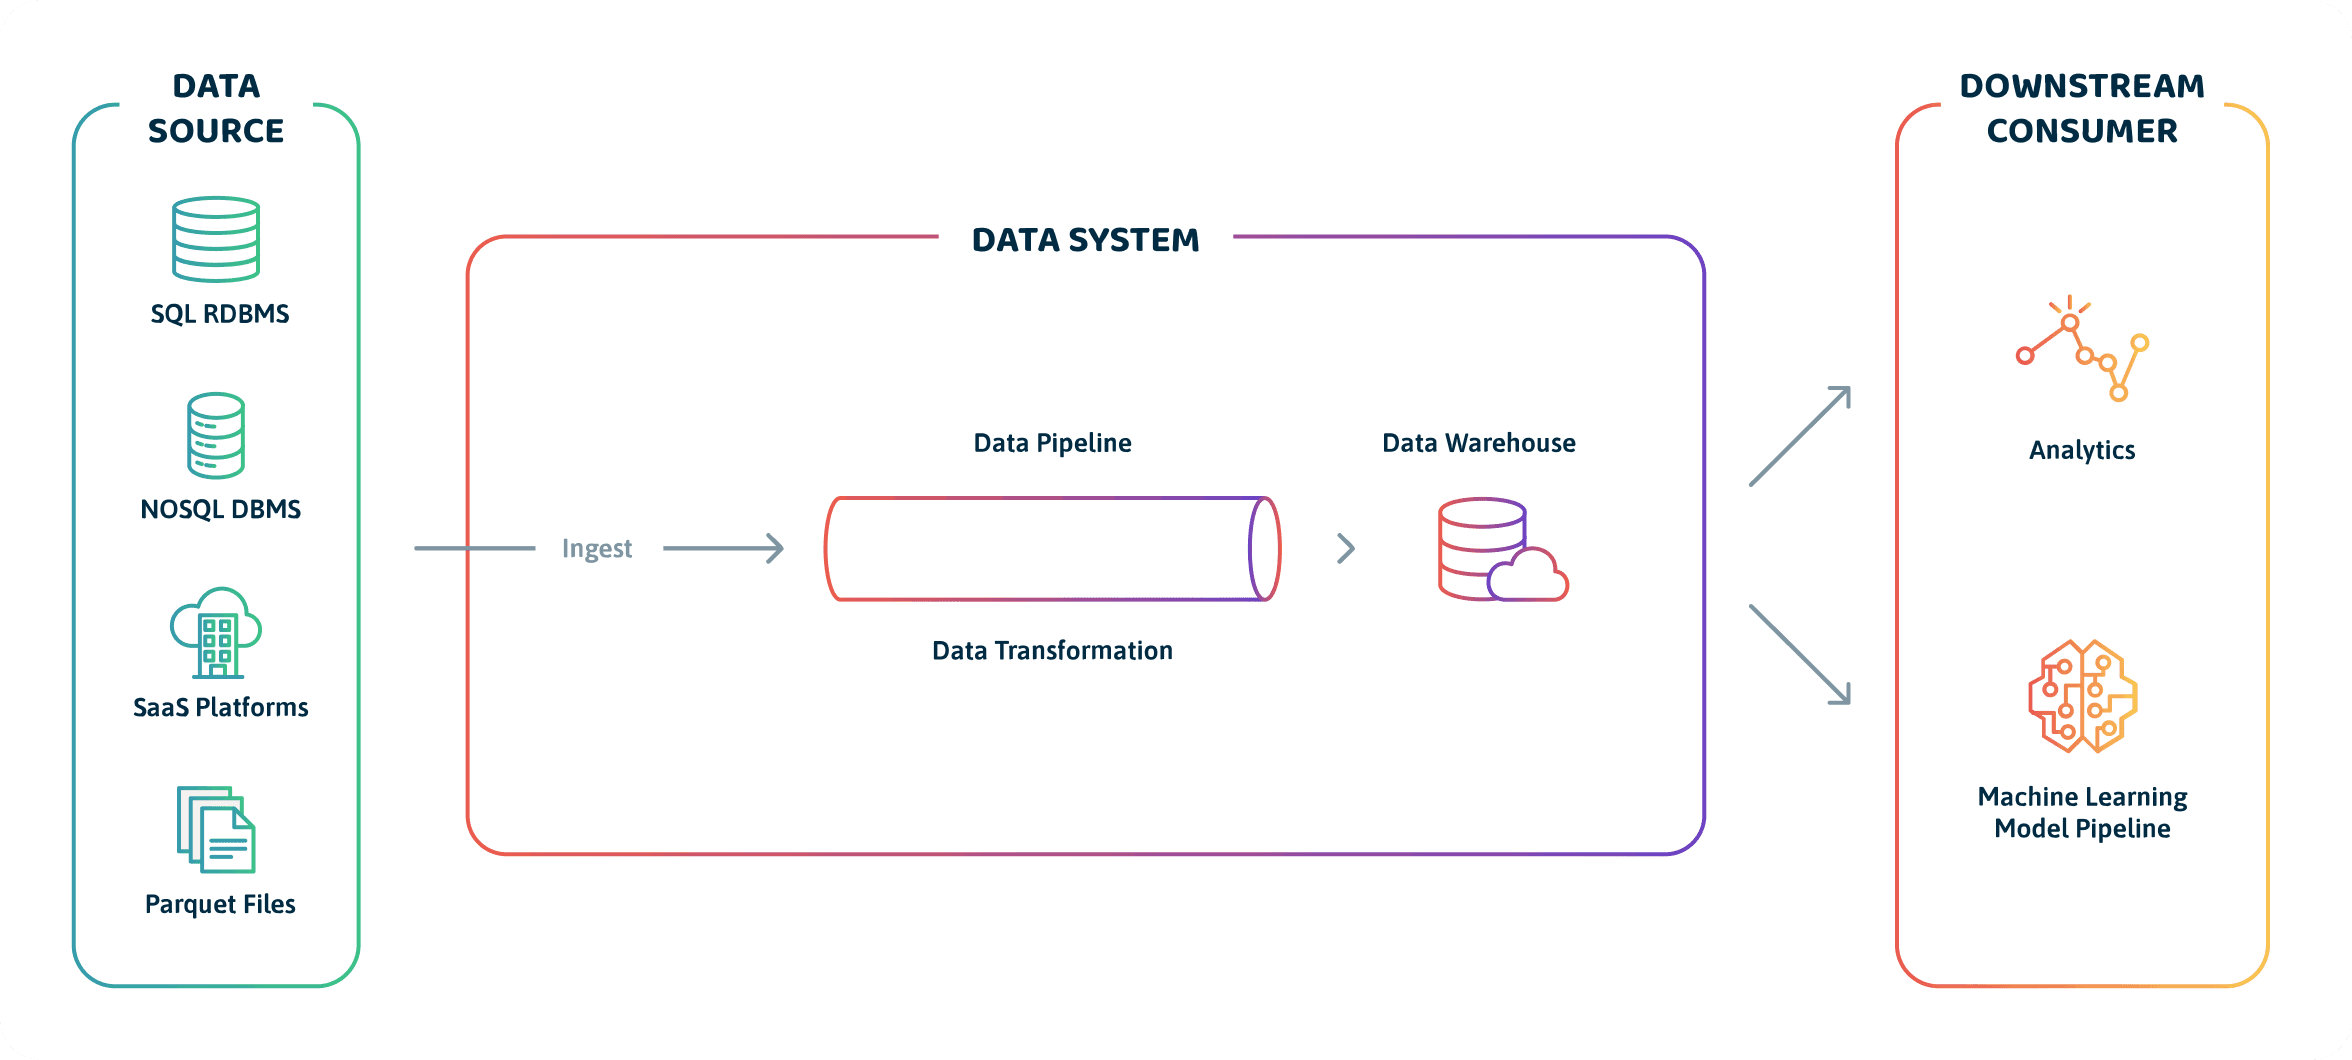
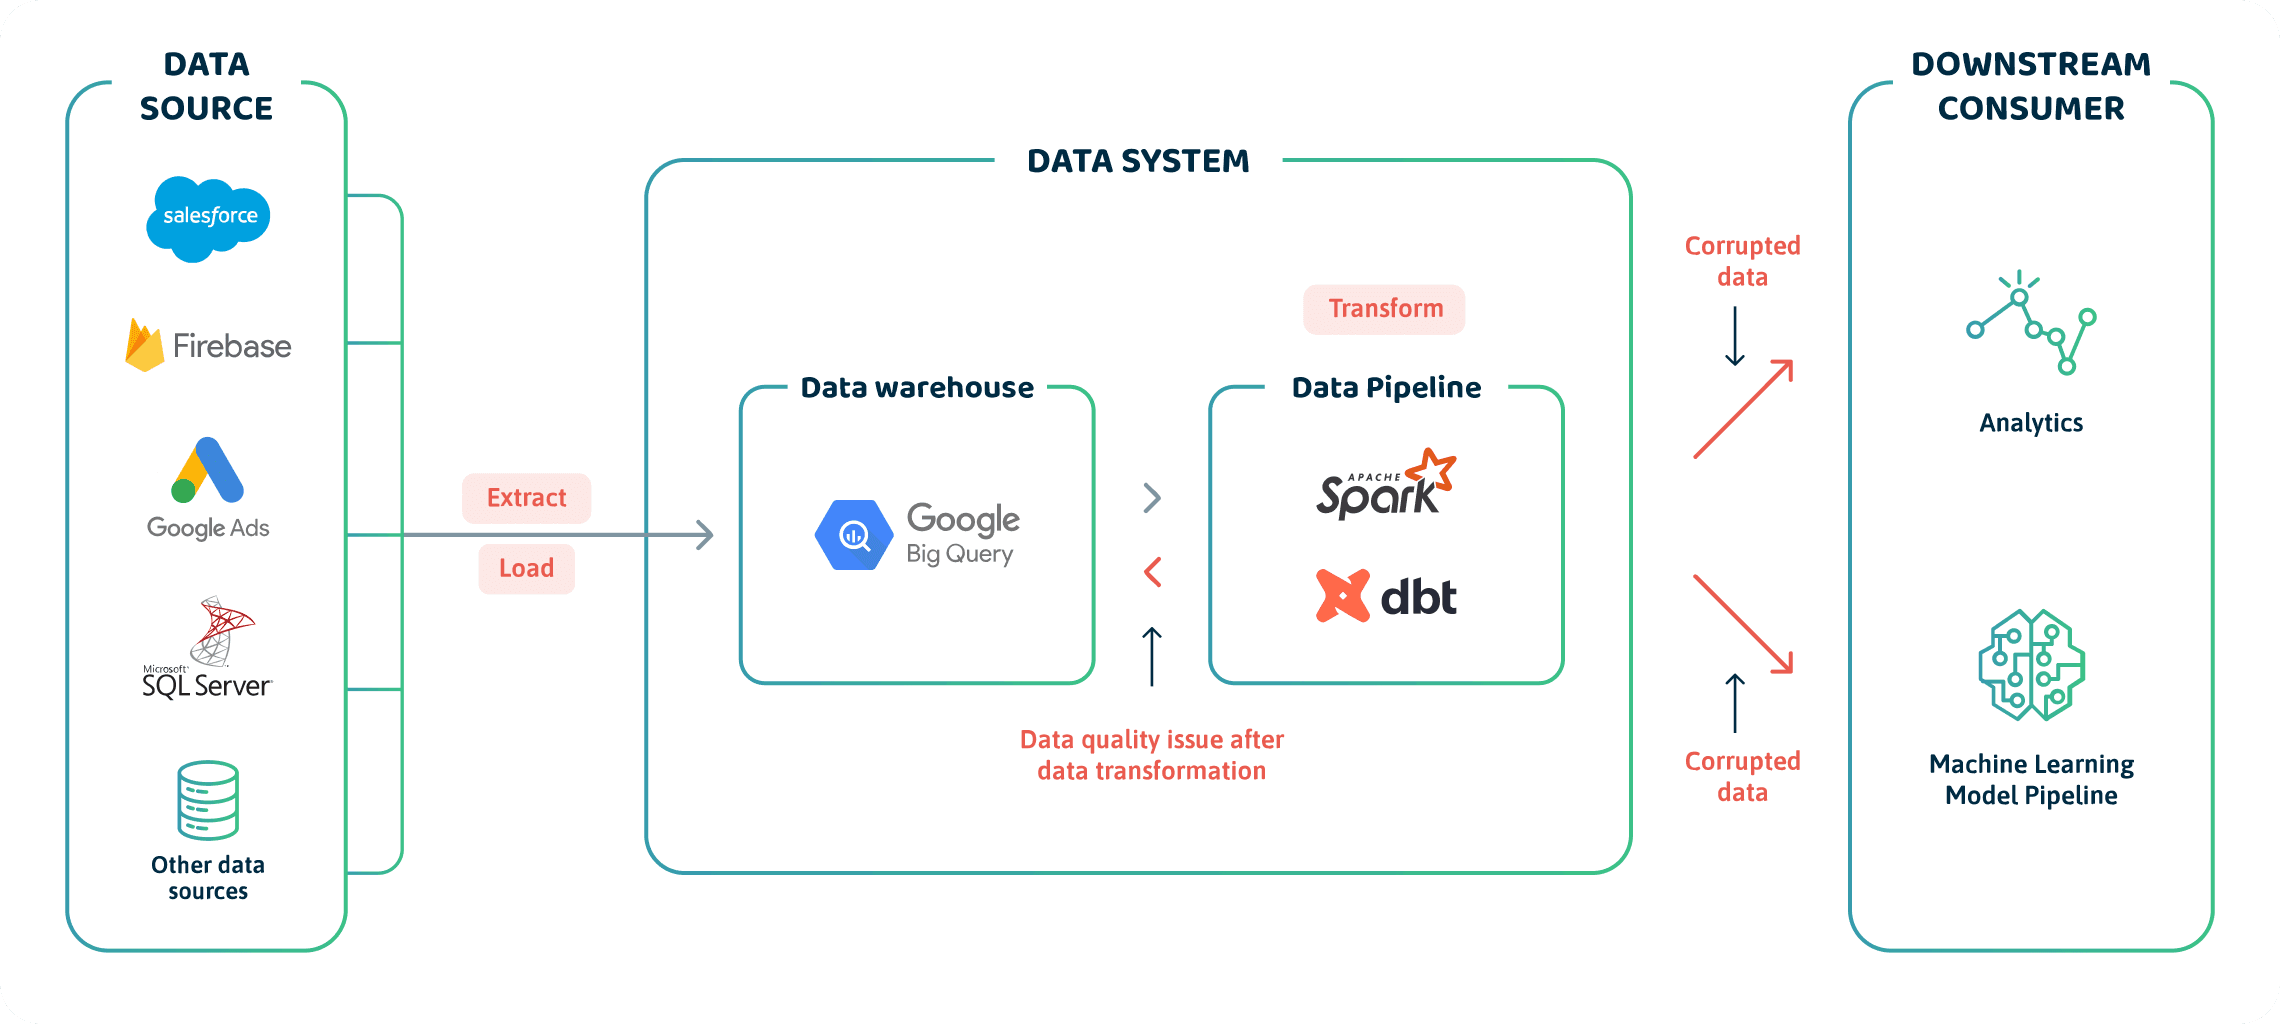
There are three significant areas where issues degrade data quality:
- Directly from the data source(s),
- Inside the data systems or pipelines (during transformation and manipulation),
- When downstream systems consume them.
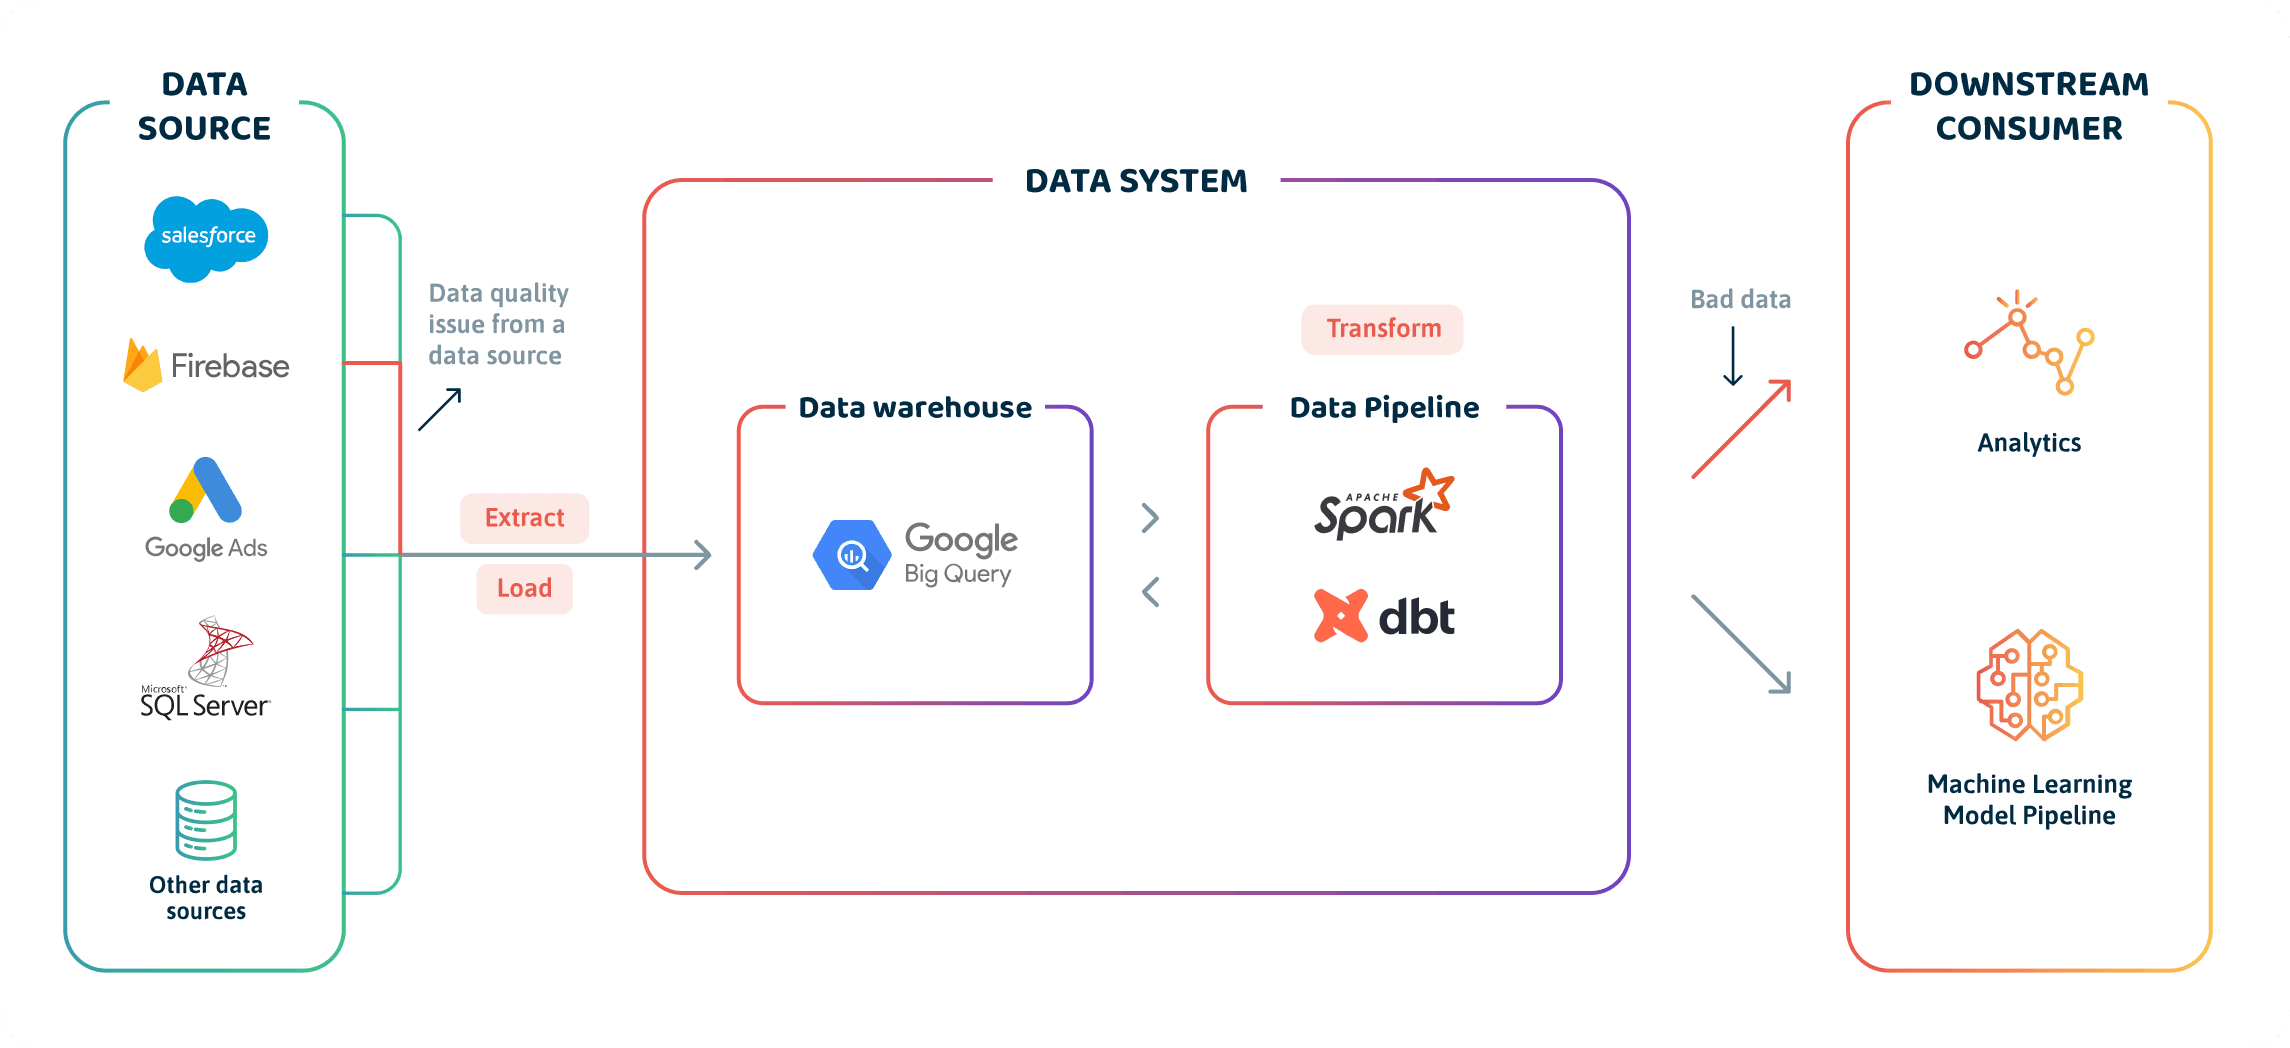
Directly from the Data Source(s)
Okay, so you have probably encountered this scenario: It’s Friday, and you are so excited about the weekend. Everything seemed to have worked well during the week, and you are about to log off from slack. Then, suddenly, your data analyst hastily calls you to inform you that the report dashboard for a particular segment of customers was broken and has led to wrong conclusions for a week now.
You start panicking because, of course, those tests you wrote should have caught these issues in the pipeline, right? If you are lucky enough, it took you anywhere from a few hours to days of thoroughly searching for the root cause of the problem. Aha! Alas, find out that mobile application developers made changes to the schema of the Firebase table that collects data from the app.
Since you were not informed and did not write validation tests to cover such edge cases, the bad data made its way through to your reporting layer. While there are several issues that you cannot account for that stem directly from data sources, there are common issues including:
- Duplicate and delayed events,
- Stale or inaccurate data gets ingested into the data system,
- An outlier in a crucial field that goes undetected until it shows up in the data reporting layer or ingested by a machine learning training pipeline,
- Data distribution drifts that you may only notice when a production ML application outputs strange results because the training data distribution differs significantly from the production data distribution.
- Missing events (events not coming in because of broken integrations),
- Wrong data type and format (wrong dollar amount; incorrect product code),
- Incorrect data syntax and semantics.
Inside the Data Systems or Pipelines
Good data pipelines mean good data hygiene and ultimately healthy data. But here’s the catch: Building good data pipelines is challenging, whether it’s an ETL, ELT, or even an rETL-based pipeline. It isn’t easy! There is a reason you might find bad or buggy transformations that lead to data quality issues.
For example, you may miswrite your transformation steps, causing your pipeline steps to execute in the wrong order. Or may write data validation tests in your pipeline in the wrong order.
The transformations within the data pipeline can cause data downtime, corrupt the data, and even cause problems for downstream consumers.
When Downstream Systems Consume Them
Data quality issues are least common at this stage, but they do occur. For example, a code modification in your ML pipeline could prevent an API from gathering data for a live or offline model. In addition, perhaps your BI analysis tool may no longer be receiving updates from your data source, producing stale reports due to some software upgrade or dependency changes.
These issues overall impact the quality of the dataset fed to downstream consumers, such as a machine learning training pipeline or analytics software. It would inevitably affect the results of such a system, potentially rendering the entire project futile.
Continuously monitoring—and going forward, observing—your data quality will guarantee that you can:
- Detect most—if not all—data quality issues,
- Troubleshoot these issues before they can cause silent or non-silent errors,
- Continuously report on, and improve, the quality of data you are using to solve business problems.
It would not just increase the trust you have in your data; reliability would likely go through the roof too.
Now you have an idea of where these issues might occur, let’s focus on what types of data quality issues you could encounter.
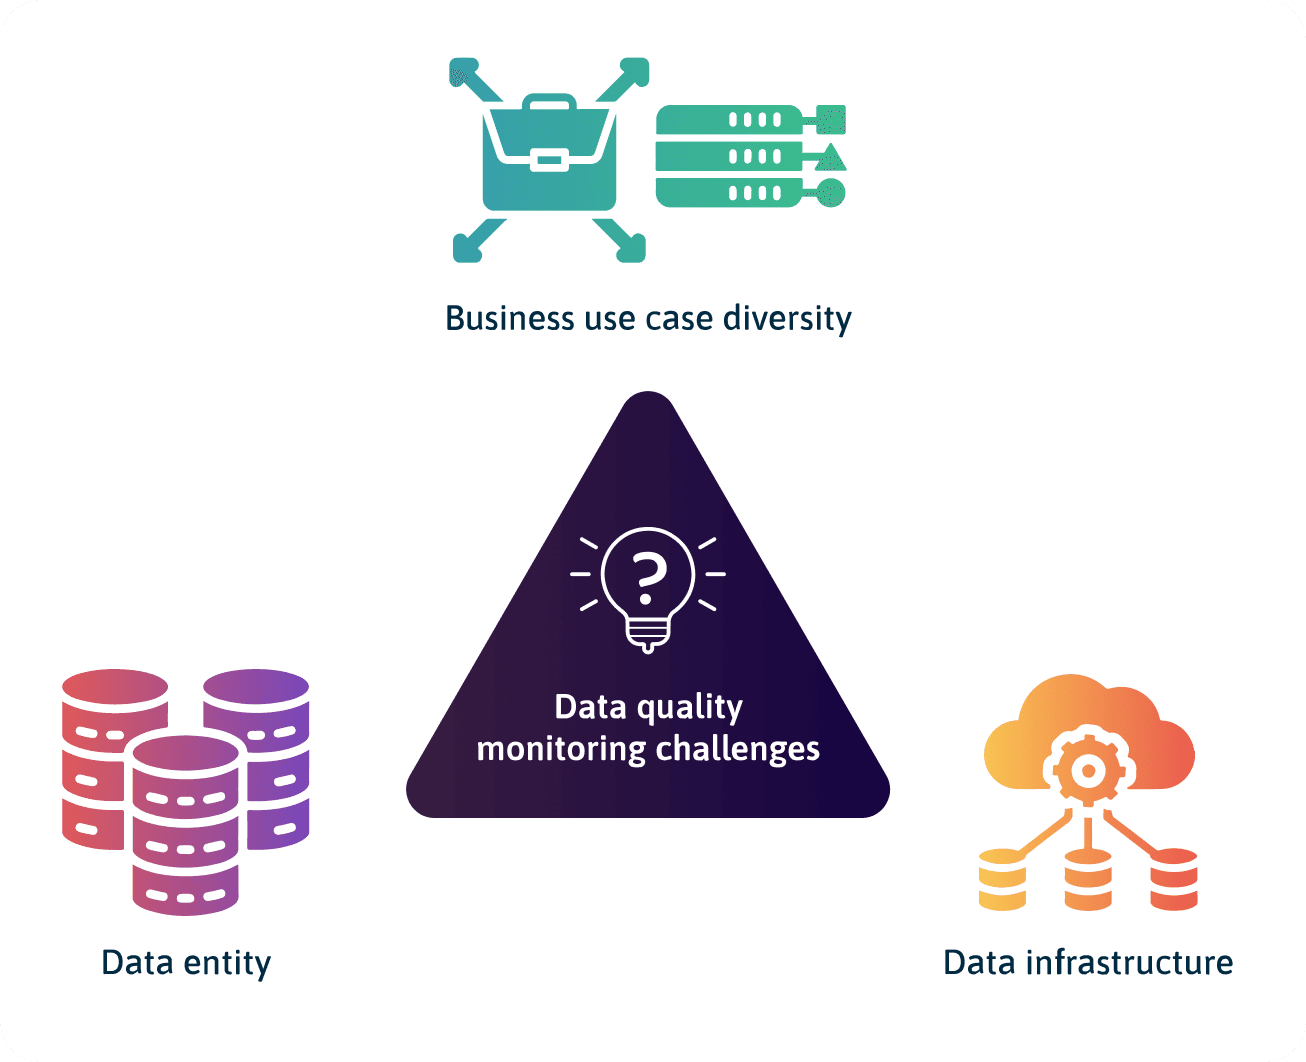
Challenges with Monitoring Data Quality
The core challenges with monitoring data quality have to do with:
- Diversity in business use cases,
- The data entity,
- The data infrastructure.
Diversity in Business Use Cases
Due to a diversity of business use cases, the data problems you are solving will likely need different technical requirements. This variety makes it challenging for anyone to define set standards for monitoring and managing data quality. Instead, data teams will need to constantly re-engage with stakeholders and data consumers on what metrics (data SLAs) are appropriate for the data system based on a particular use case.
With a diversity of use cases (for example, time-series use cases vs. recommendation use cases) comes different domain-specific quality checks. You would need to run these checks to assess various data quality issues, which, as you probably know, is already a challenge to anticipate and monitor.
Data Quality Monitoring Challenges as a Result of the Data Entity
Some of the challenges with monitoring and managing data quality that stem from the data itself include:
- Data scale
- Data cardinality
- Data fragmentation
- Data legalities
Data Scale
With the exponential growth in the volume of data comes the need to validate the dataset in real-time to ensure businesses can make the most of their data.
Monitoring data quality with increasing data volume can be challenging. The increase in data volume can lead to an increase in the number of data quality issues that need to be monitored, triaged, and perhaps troubleshot.
Another problem with data scale is its ephemeral nature. Monitoring may also be challenging if you do not persist high volume data somewhere.
Data Cardinality
High data volume will inevitably lead to high data cardinality—this is not necessarily bad (because high cardinal data could also mean more valuable data), but this could cause your data structure to be inconsistent. So you would often need to adapt your data quality monitoring techniques to account for structural changes.
Data Fragmentation
Data assets (such as metadata) and dependencies are scattered across systems and organization use cases, each containing a small amount of information, making it difficult to centralize quality monitoring and management efforts.
Data Legalities
In most situations, data security is crucial, and it’s often vital that whatever solution or technique you use to monitor the data quality does not compromise the data security.
Other legal issues are around monitoring data with personally identifiable information (PII) and ensuring the data values are protected while using the monitoring technique or solution.
Data Quality Monitoring Challenges as a Result of Data Infrastructure
Some data infrastructure challenges that can make it challenging to monitor the quality of data include:
- The complexity of the data architecture,
- Data pipeline workflow complexity,
- Data source orchestration.
The Complexity of the Data Architecture
You can link this challenge to the use case diversity challenge mentioned earlier. Most business use cases require data to be continuously streamed into data pipelines in “real-time” and not just in scheduled intervals (batch mode).
The high data throughput makes monitoring the quality of the data complex because users and systems have to be proactive in triaging and troubleshooting data quality issues in real-time.
Data Pipeline Workflow Complexity
Data pipeline workflows have grown increasingly complex, especially with the data scale, the explosion of use cases, and the advent of workflow orchestration tools. It is hard to monitor data pipelines with a dozen stages and many branches and even more challenging when someone makes an unanticipated change to the pipeline.
Data Source Orchestration
When monitoring data quality, ingesting data from various sources adds a lot of overhead. The larger the number of sources, the more complexity likely that you would have to deal with similar and varying data quality issues.
Looking at these challenges, you will realize that the process of monitoring data quality requires a thoughtful and continuous approach. Therefore, you need to consider these challenges to develop your continuous monitoring approach to data quality.
What Should You Monitor in Your Data Systems?
Knowing what to monitor in your data system to ensure high-quality data is tricky because it is often problem-dependent with no set standards. Like with monitoring regular software systems, several custom and standard metrics to monitor. However, we can take a page from software monitoring and observability.
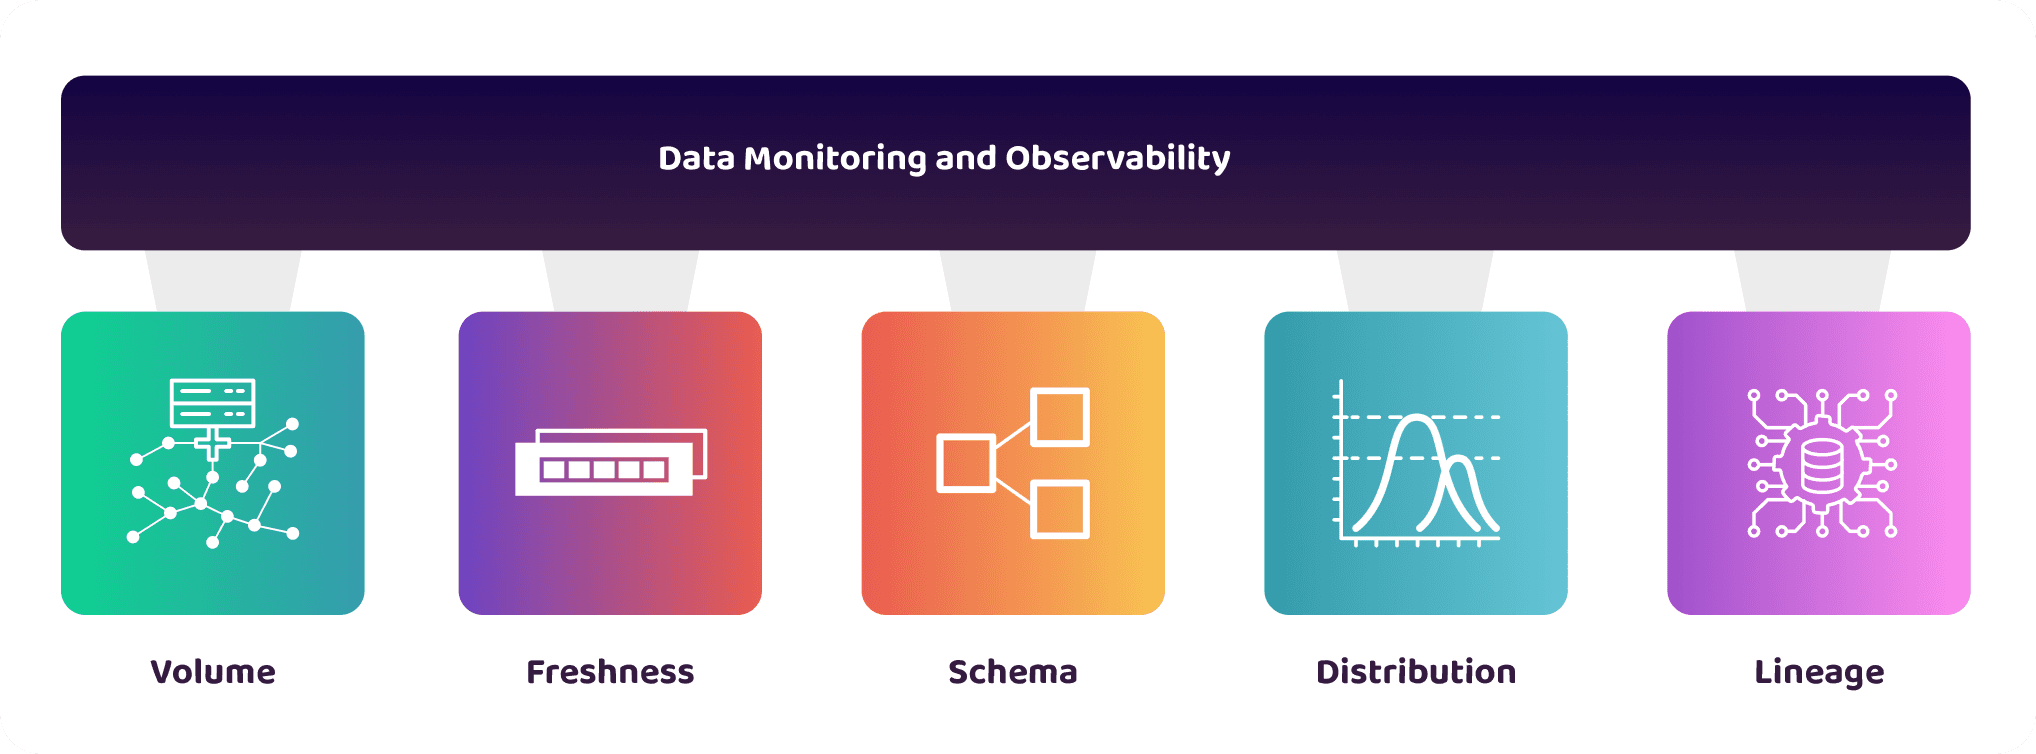
Software observability has three pillars: logs, metrics, and traces. We can adapt these pillars to data monitoring (or generally, observability) to help us understand if our data is fit for purpose and meets expectations:
Volume:
- Monitors the data system to know if all the expected data have arrived.
Freshness:
- Monitors the time the data arrived into the data system, the recency, and if the data is up-to-date with its dependencies.
Schema:
- Monitors the data structure and dimensions. It includes how they have changed, including the source of the change and who made the changes.
Distribution:
- Monitors the data distribution to check within an acceptable range and if the data pipeline properly transforms the data,
Lineage:
- Monitors the upstream sources and downstream consumers impacted by the data. You can also trace who interacts with your data and at what stages.
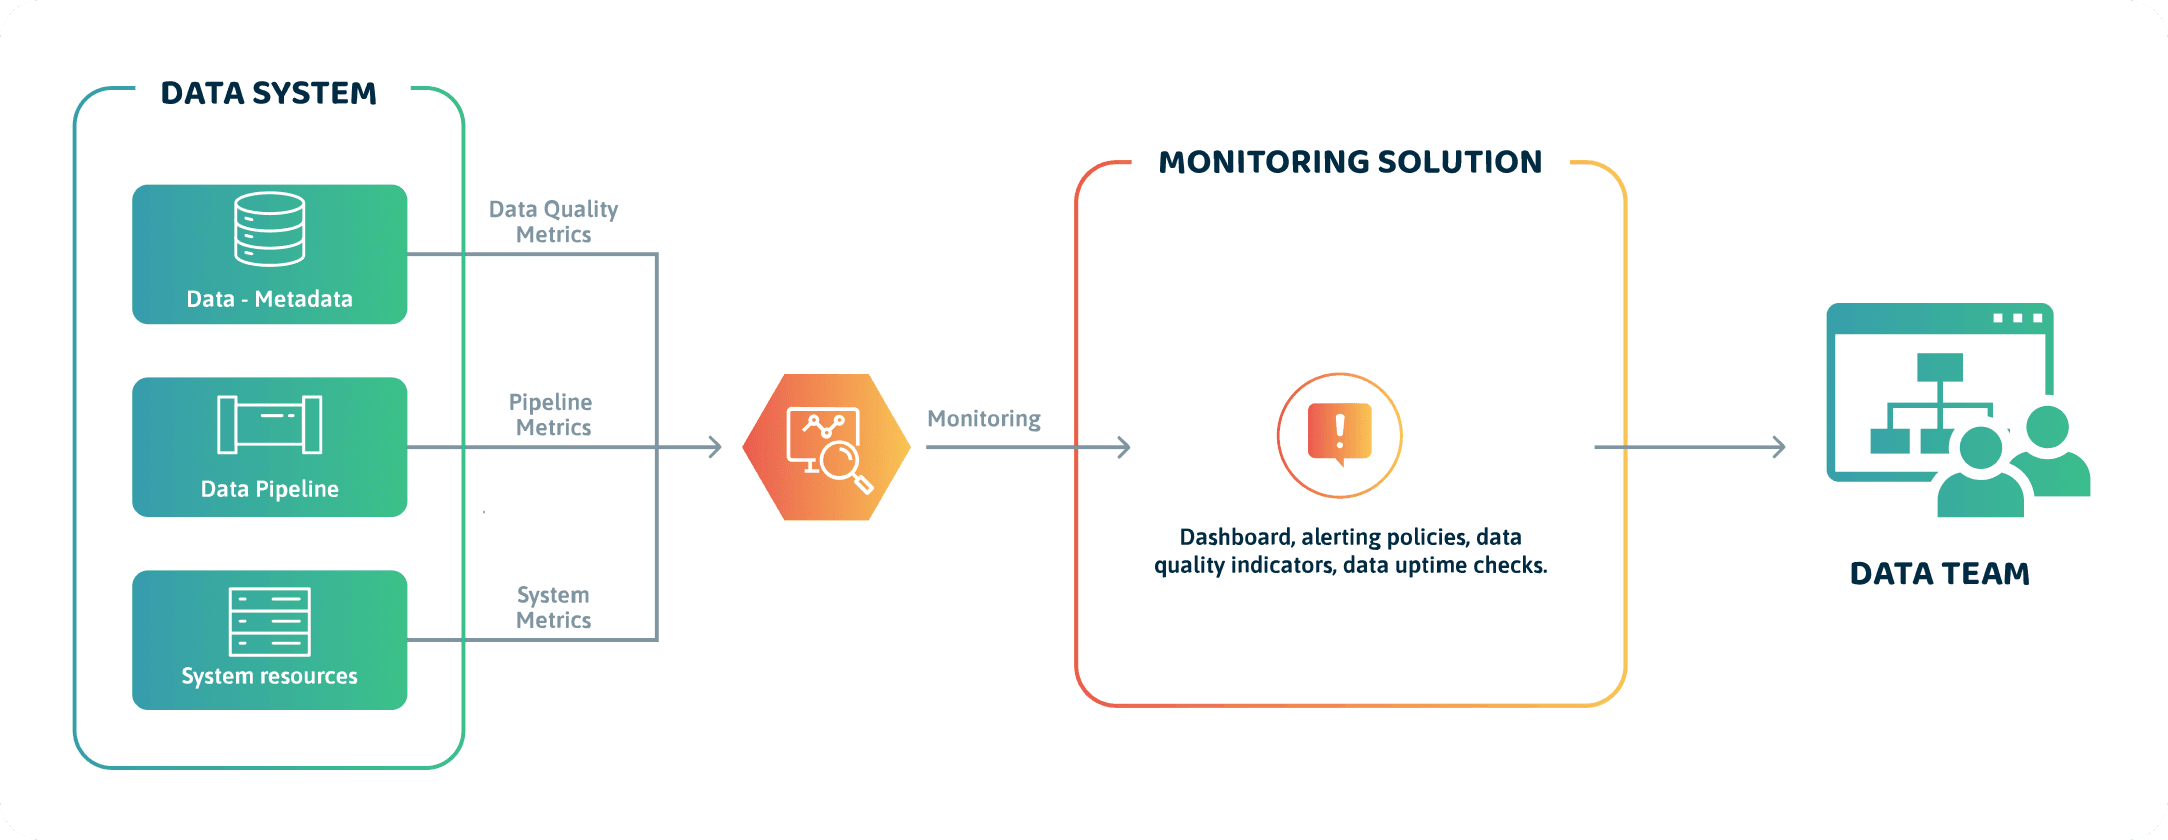
In most solutions, a data profiler (such as whylogs) generates the metadata about the data from the upstream source (or data producer). The metadata provides the information required to appropriately observe the data system with the five data observability pillars listed above. It can be a good source for the data quality metric.
Before we continue, you should know a subtle but crucial difference between data observability and monitoring. Monitoring tells you when something is wrong with the quality of your data, while observability enables you to understand why you encounter data quality issues and what to do about them.
Choosing What to Monitor in Your Data System
Choosing what to monitor is dependent on the type of business problem you are solving, so you need to make some considerations before deciding what to monitor. These considerations are based on your data problem, profile, resources, and operational impact of the data.
Considerations
There are four considerations you want to make before choosing what to monitor in your data system: (Credits to Frank Dravis in his whitepaper on data quality strategy.)
How Often do Downstream Systems Consume the Data?
Is it hourly, daily, weekly, monthly, or other periodic intervals? The rate at which the downstream systems consume data will inform you what approach to take during monitoring and the crucial issues to monitor.
What’s the Importance of the Downstream System Consuming the Data?
ML models used for mission-critical, life-dependent, routine operations? Or is it a BI tool used for end-of-the-month reporting? In some cases, ML Engineers might want to deploy ML models for healthcare applications, highly regulated applications, or those prone to biases.
When you consider this, you will know the most important issues to monitor—especially when you talk to domain experts.
What’s the Cost of Monitoring the Data?
After establishing the monitoring system and process, the direct costs are labor and system resources—ideally, the better the monitoring technology, the lower the labor costs. You may want to log many issues, but knowing the cost of monitoring, you can hone in on monitoring the most critical issues—including those you don’t know.
What’s the Operational Impact of the Data?
Can you estimate the cost of poor data quality provided into these systems in cases where the complex dataset feeds crucial downstream consumers? How impactful are data quality issues encountered concerning the department’s or organization’s targets?
There are two aspects to consider here:
- Impact of assessing operational (production) data during live operations,
- Impact of the process on all stakeholders involved.
This will inform you whether to manually audit the quality assessment process, partially automate it, or fully automate it.
Data Quality Indicators (DQI)
Data quality indicators (DQI) can be thought of as “key performance indicators” to assess data quality. Like KPIs, a DQI must:
- Be well-defined and measurable,
- Apply to the business use case,
- Meet the business requirements and data SLAs.
You can define your DQIs around the five pillars of data observability discussed earlier in this section.
Data quality monitoring solutions would usually have built-in DQIs dependent on your data. Of course, you may need to make some maneuvers to monitor unstructured data, but most tools would allow you to use a query (like SQL) or programming language (like Python) to define your indicators.
Since business use cases differ, you may also need to define DQIs specific to business use cases to ensure you have your bases covered.
Key Metrics to Assess Data Quality
Some other metrics that may be helpful for you to measure data quality:
- The ratio of data to errors: What’s the total number of errors per the dataset size you ingest into your pipeline?
- Number of empty values in your dataset: This indicates incomplete data.
- Data transformation error rate: How many errors occur due to lousy transformation in the data pipeline?
- The amount of “dark data”: What amount of data is not useful due to data quality issues? You can analyze this by performing data discovery and profiling.
Again, these are non-exhaustive but should be one of the first ones you look out for.
How to Implement Data Quality Monitoring
Data quality monitoring is a part of an overall process in managing data quality. To implement data quality monitoring, you must have considered your data quality strategy. There are two instances you might want to implement monitoring:
- To address existing data quality issues,
- To plan a data quality approach for a new problem.
Addressing Data Quality Issues in Your Data Systems
Below are some other crucial steps when you notice that the data in your data system might be corrupted:
- Perform root-cause analysis of the data with issues,
- Profile the problematic dataset,
- Make considerations on what to monitor,
- Choose a continuous monitoring approach,
- Implement the continuous monitoring solution,
- Test the continuous monitoring solution,
- Report to management.
Perform Root-Cause Analysis of the Data With Issues
Identify the stage(s) in your data system that data quality issues consistently plagued. Essentially, get an idea of these issues—it does not have to be elaborate.
Profile the Problematic Dataset
Familiarize yourself with the data, including the schema and other statistical information on the data—of course, how you do this will likely be dependent on the amount of complex dataset you need to profile.
After that, explore all dependencies of the complex dataset:
- What workflows are your datasets dependent on?
- Understand how your most critical data assets flow through your system, including the pipelines that ingest them,
- Where is the data transformed?
- What are the downstream systems consuming them?
Make Considerations on What to Monitor
In the previous section, you have learned to identify what you want to monitor. Ensure you relate issues you identify with considerations on what you want to monitor.
Choose a Continuous Monitoring Approach
Choose an approach that can, at the bare minimum, help you track those issues—these are the must-haves. Depending on the organization’s processes and existing toolstack, that could be an open-source solution or an enterprise solution. The most important thing is that the tool checks the boxes to monitor issues that consistently affect your system.
We’ll take a deeper dive into your continuous monitoring approach in the section below.
Implement the Continuous Monitoring Solution
Deploying the solution you end up using will involve configuring and fine-tuning the monitoring software for the business use case for the considerations you made earlier on what you want to monitor.
Test the Continuous Monitoring Solution
Test the entire solution to make sure it works as expected. For example, you are getting accurate alerting (not false positives and negatives), the solution is scalable, generalizable, and easy to use by others.
Report Management
Figure out what will happen to the information your monitoring solution outputs. For example, what formats should the reports use, and who should receive them? What mediums should alerts be delivered? Who should be responsible for taking specific actions?
Planning a Data Quality Approach for a New Problem
At the high level, here are some steps you might want to take when getting started with data quality monitoring for a new problem:
- Understand business, data, and technical requirements.
- Define key metrics.
- Relate metrics to data assets and entities.
- Choose a continuous monitoring tool.
Understand Business, Data, and Technical Requirements
What requirements must be met to consider your data suitable for the business problem in question? Understanding the business requirements for your use case would help you develop the data and technical requirements needed for successfully monitoring the quality of your data.
Define Key Metrics
You also want to define the key metrics relevant to the specific business use case. For example, a key metric may be for a data pipeline to output an average customer order every day at 8 PM to the data presentation layer (such as a Tableau dashboard).
The goal here is to align the business requirements with technical requirements for the data system. What are the SLAs, SLOs, and SLIs that would be required to run the system successfully? The output from this step should give you the insights necessary to set metrics for the five pillars of data observability we discussed earlier.
Relate Metrics to Data Assets and Entities
Once you identify the key metrics, you can relate them to the datasets, data assets, and data dependencies that would help achieve such metrics. This way, you identify the most crucial data flows you want to monitor and manage.
This goal here is to help you understand how your data flows end-to-end. From here, you can also use the key metrics to write data validation tests based on what sort of issues you can anticipate—your “known unknowns” and choose what to monitor.
Choosing a Data Quality Monitoring Solution
The goal of any optimal data quality monitoring solution should be to help you, as an Engineer, find and fix data quality issues quickly. In addition, such a solution should also help you overcome the data quality monitoring challenges we discussed earlier.
In the second article in this series, you will learn how to choose an ideal data quality monitoring solution for your use case.
Conclusion
In summary, data quality monitoring answers the question of trust and reliability with your data: How reliable is the data your pipeline is ingesting across your entire data system? As an engineer, you want to understand the quality of the product (in this case, data) you are working on to ensure the systems you are building are reliable and won’t fail and cause business harm.
A lack of control or visibility into data quality can lead to inaccurate insights, leading to poor decisions, which can result in lost income or a poor customer experience.
