
A way to uncover new business opportunities is to analyze your system, collect what you really need, and visualize it through a comprehensive graph! Log traces are a great place to start because they usually contain useful information on your customers’ interests. You just need to transform them. This blog post will show you how to transform raw data from Istio access logs collected by Promtail into valuable metrics visualized through Grafana Cloud.
This article was originally published by Grafana Labs.
The scenario
Your e-commerce platform is selling different pairs of socks. Customers can filter the socks catalog based on their personal interest. You want to find out which pair of socks is most filtered by “formal” or “geek.”

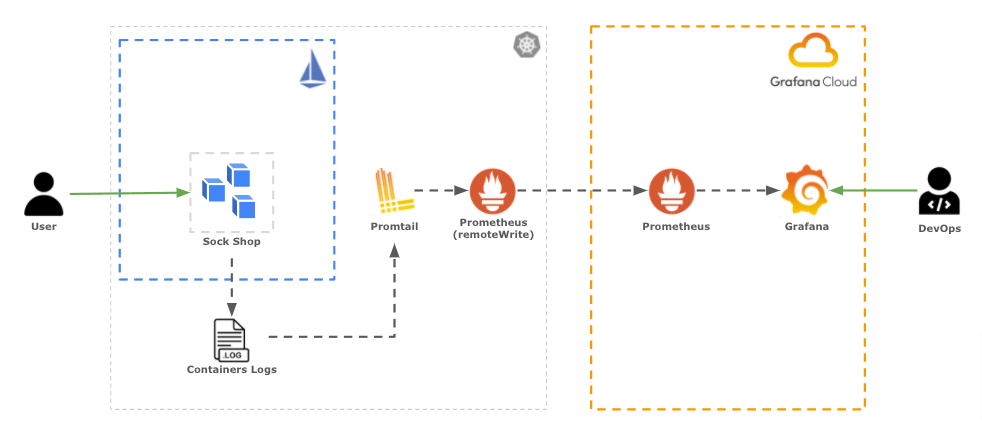
Your architecture will look like this:
Hands-on setup!
Prerequisites:
- Kubernetes cluster – e.g. Kind
- Istioctl (this example uses version 1.12.1)
- Helm
- Grafana Cloud free account
First, let’s set up your Grafana Cloud stack:
- Create a free Grafana Cloud account if you don’t already have one.
- Sign up with existing credentials (Google, Github, etc), create your account, and obtain your own stack on the Grafana Cloud Portal.
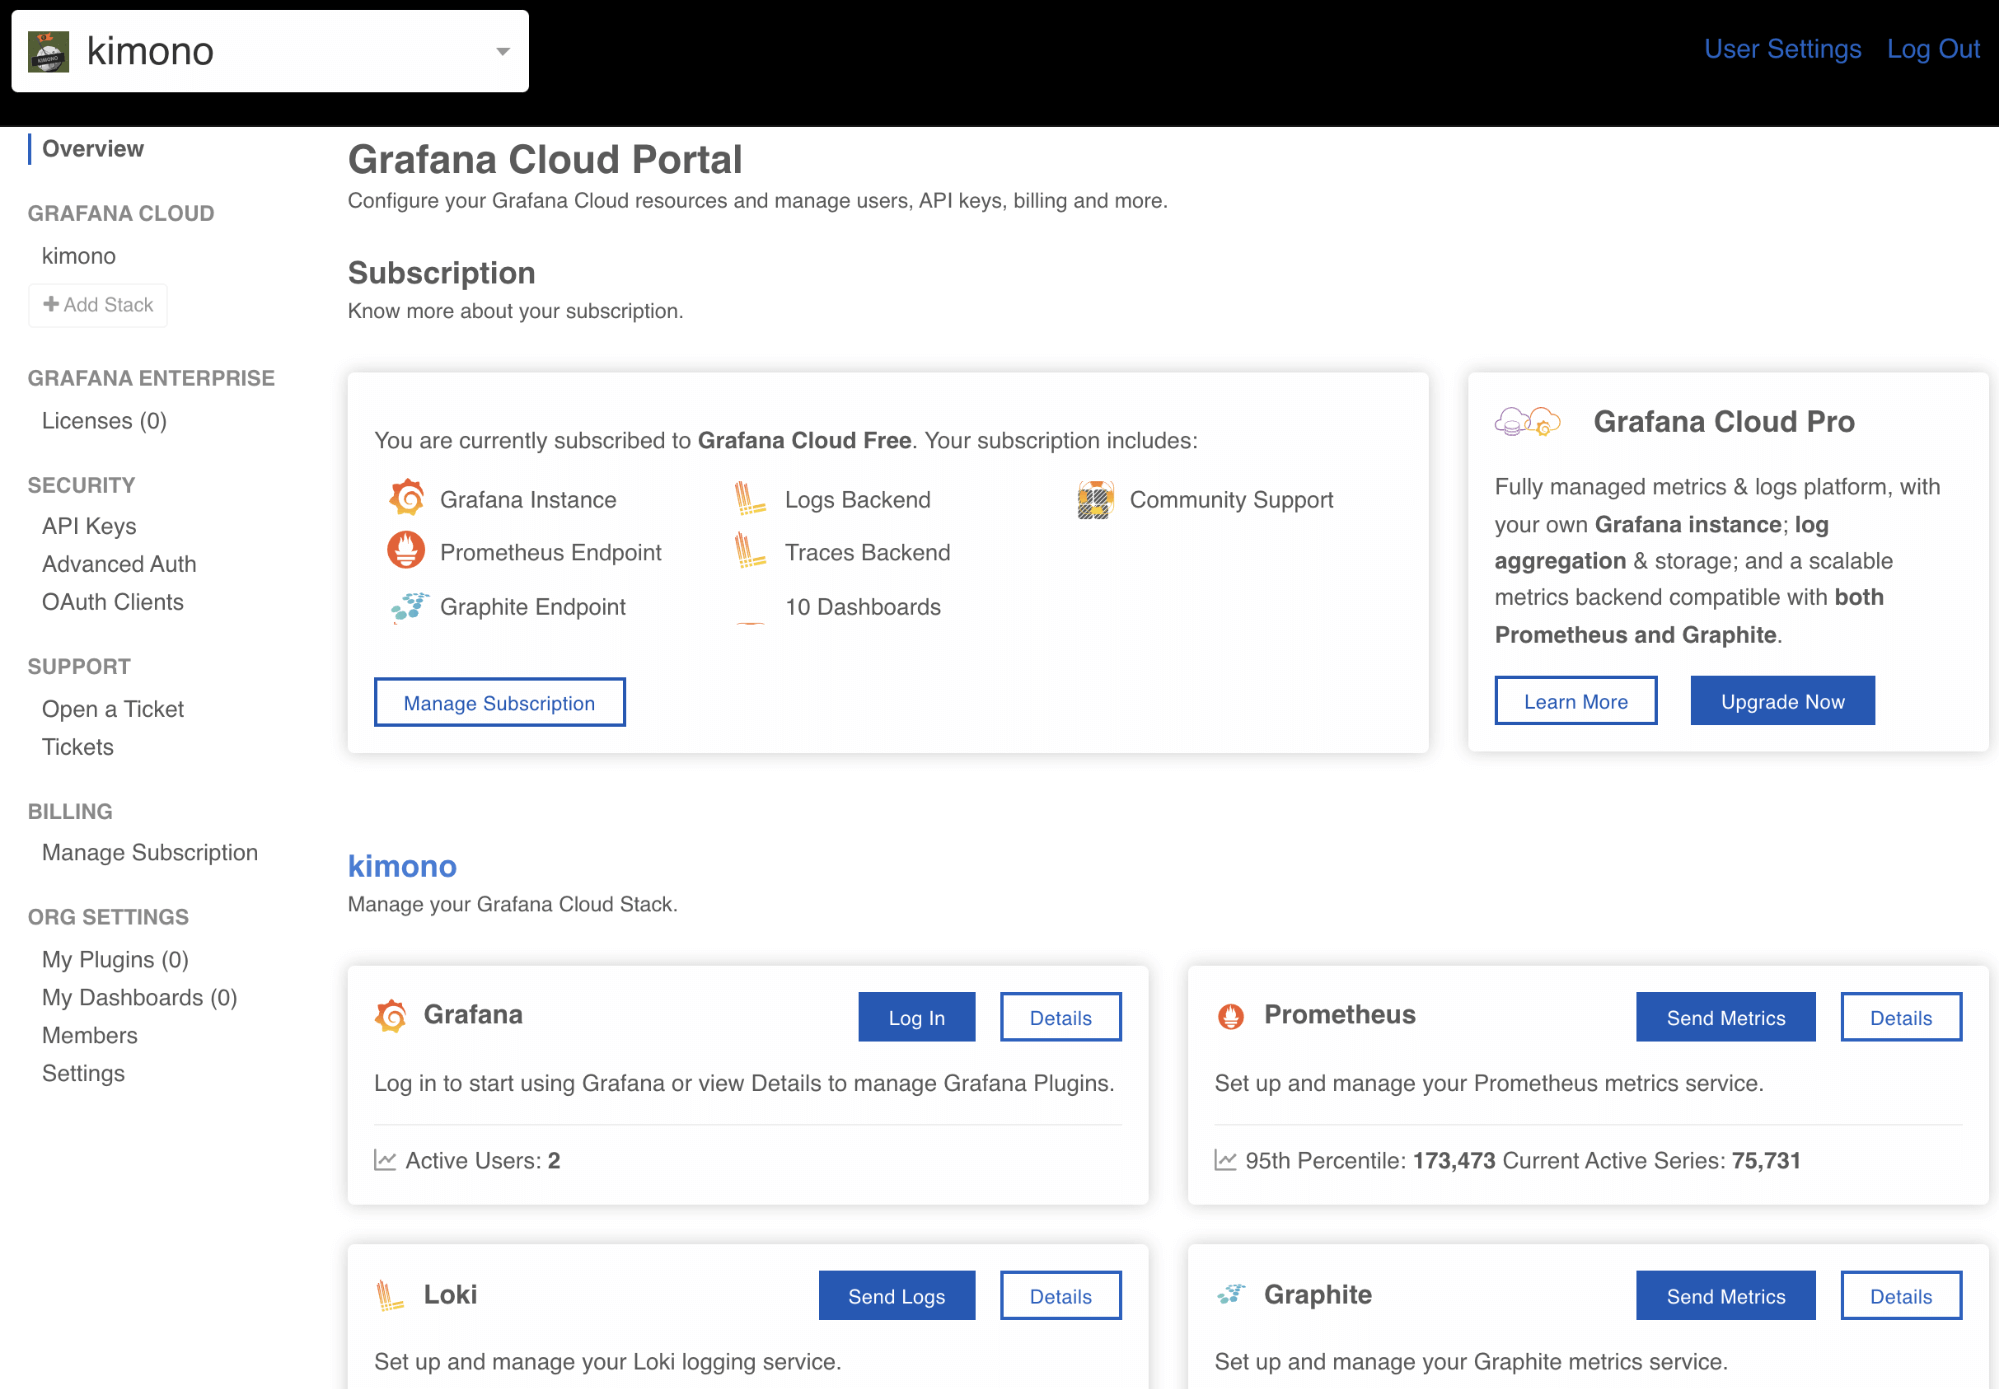
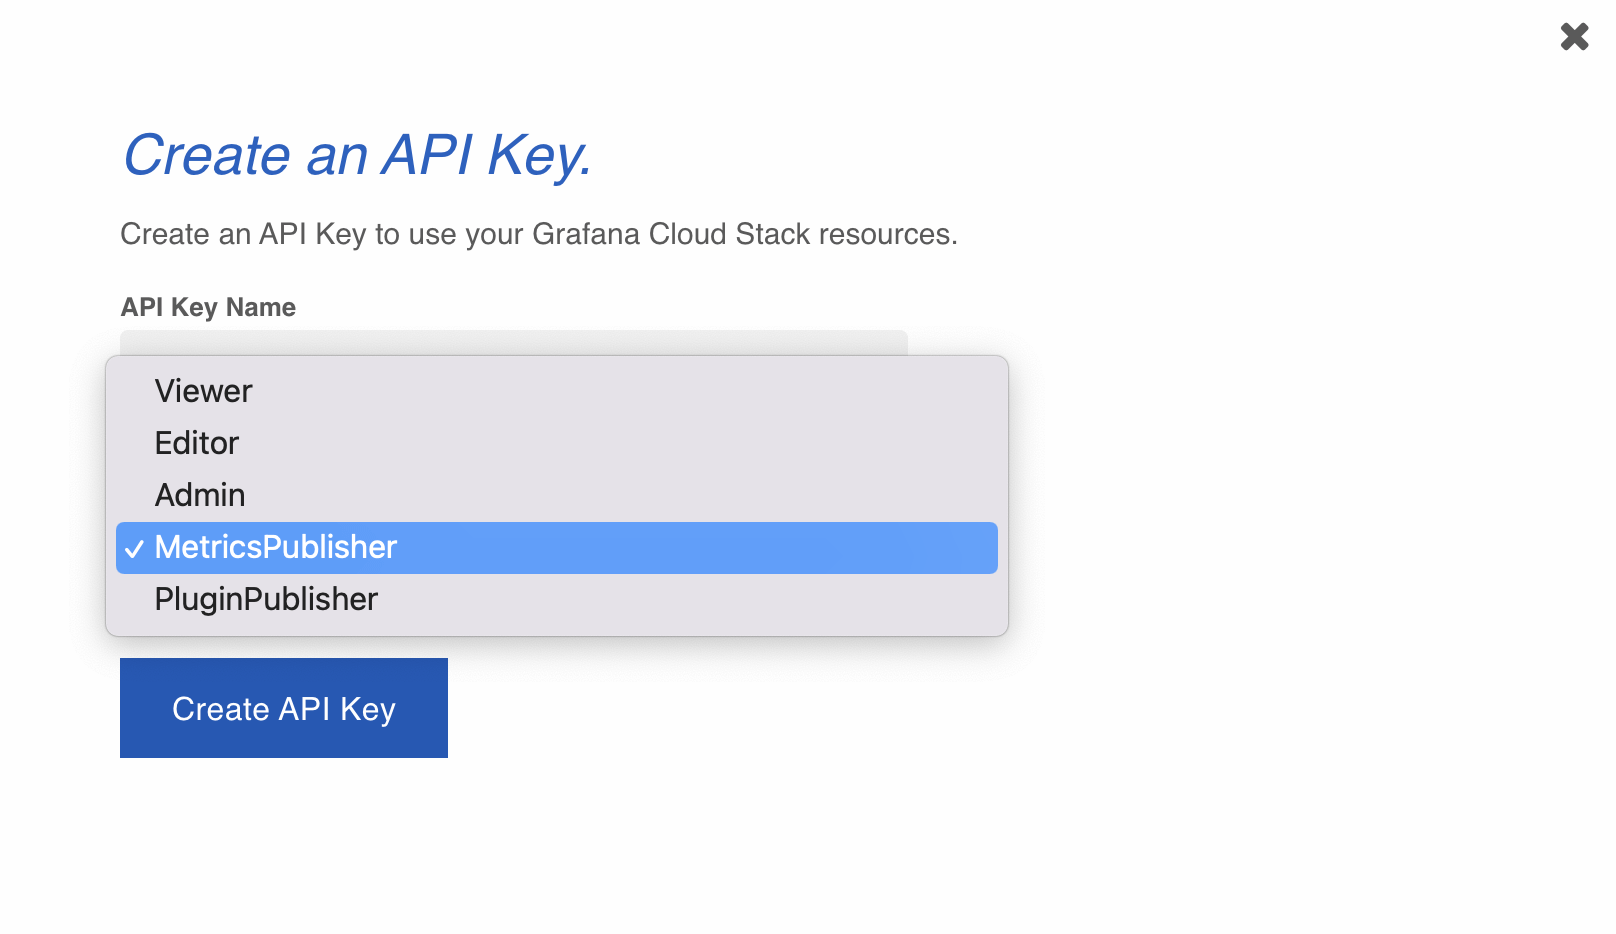
- You will also need to create a Grafana Cloud API key with metrics push privileges!
- Click on “Send Metrics” next to Prometheus to navigate to Grafana Cloud’s Prometheus Configuration page.
- Scroll to find the Password/API key section.
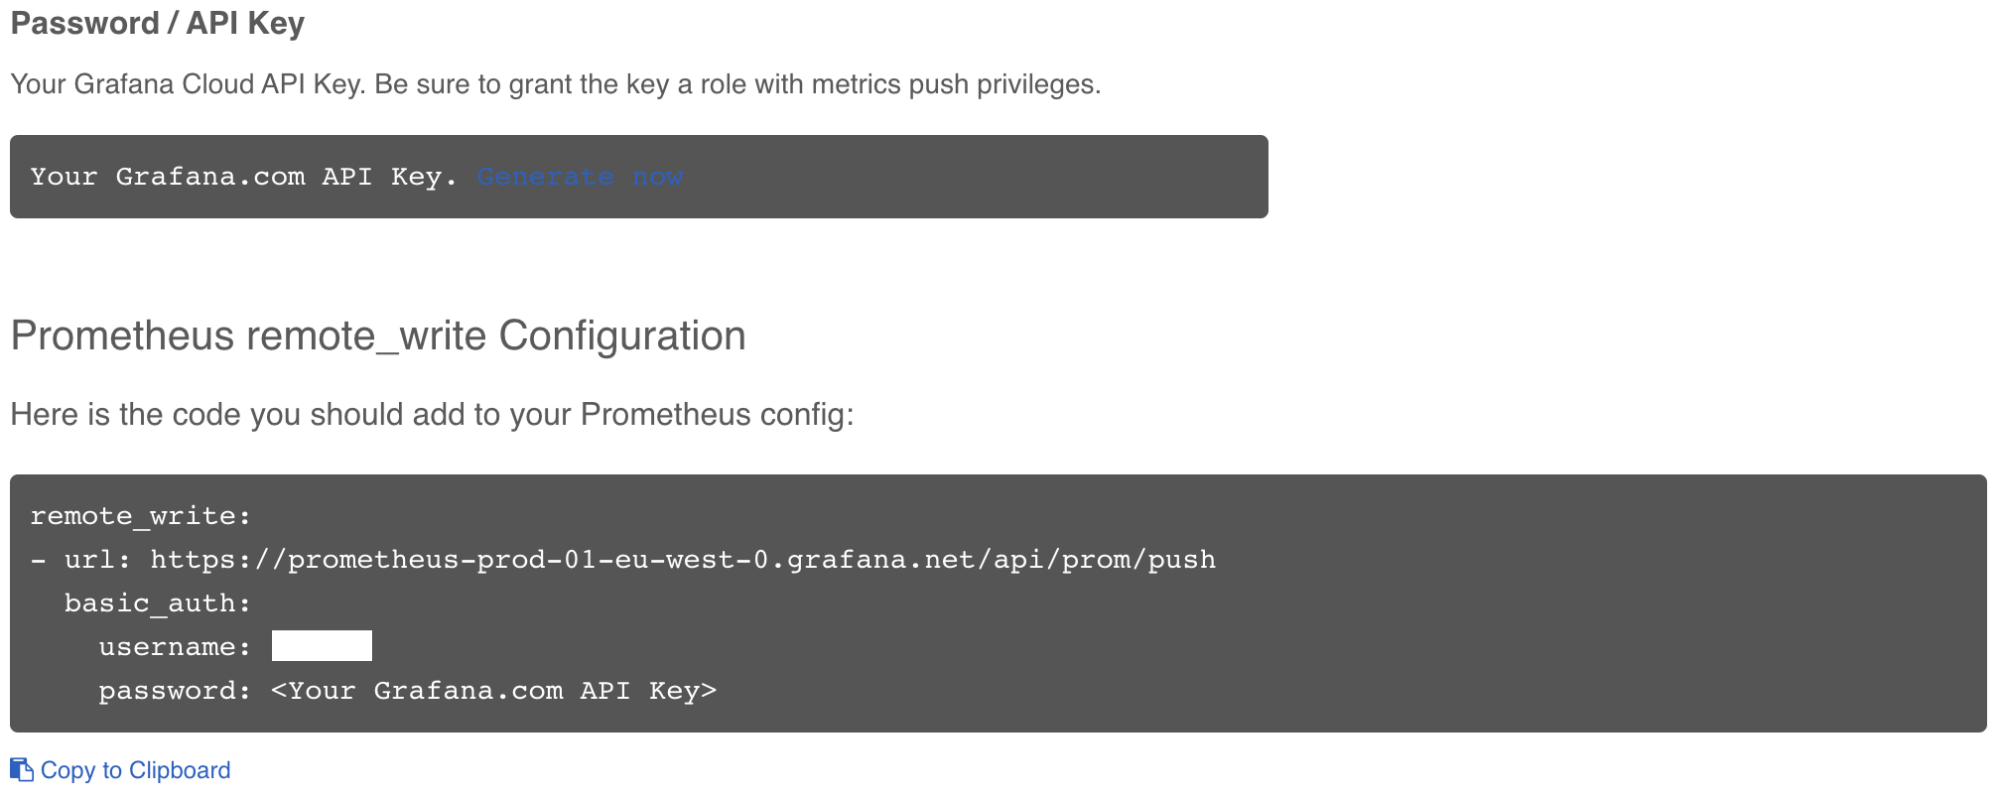
- Click on the blue text “Generate now.” In the new window, make sure to select “MetricsPublisher” from the dropdown Role list when creating your API key.
- IMPORTANT note: Grafana Cloud’s Prometheus Configuration page also contains the following required information for being able to send Prometheus metrics to Grafana Cloud:
- Remote Write Endpoint
- Username / Instance ID
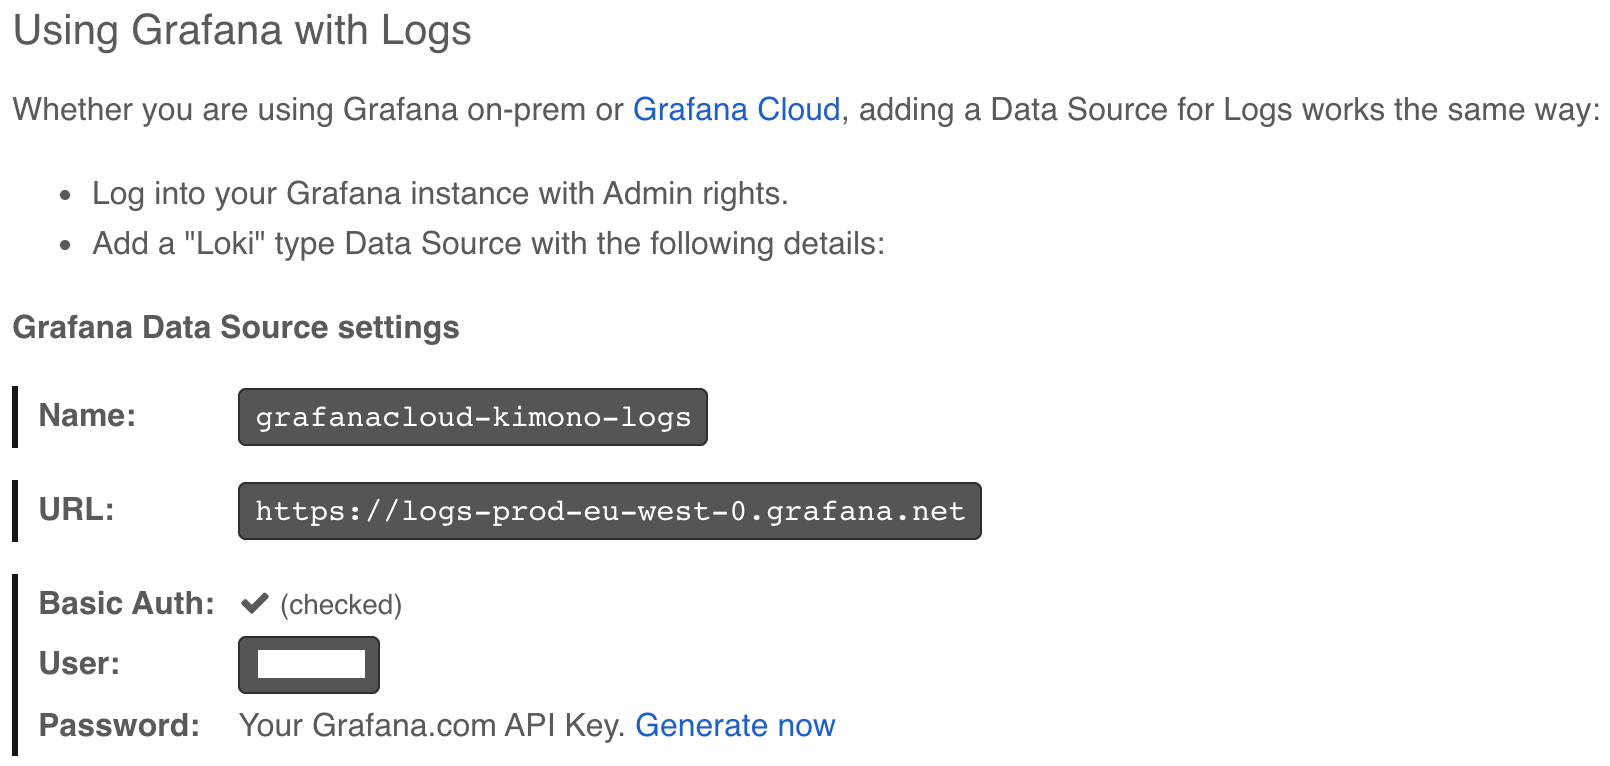
- Navigate back to the Grafana Cloud Portal and click on “Send Logs” next to Loki.
On the “Using Grafana with Logs” page, scroll to find the Grafana Data Source settings. You will need the User value when deploying Promtail.

Now, on the Kubernetes cluster, install Helm repositories.
helm repo add grafana https://grafana.github.io/helm-charts
helm repo add bitnami https://charts.bitnami.com/bitnami
helm repo update
Install Istio operator.
istioctl operator init
kubectl apply -f - <<EOF
apiVersion: install.istio.io/v1alpha1
kind: IstioOperator
metadata:
  name: istio-operator
  namespace: istio-system
spec:
 profile: default
 meshConfig:
   accessLogFile: /dev/stdout
   accessLogFormat: |
     accesslog [%START_TIME%] "%REQ(:METHOD)% %REQ(X-ENVOY-ORIGINAL-PATH?:PATH)%"
EOF
Wait until Istio is up and running.
Install the sock-shop application. You can read more about the application design here.
kubectl create ns sock-shop
kubectl label namespace sock-shop istio-injection=enabled --overwrite
kubectl -n sock-shop apply -f
https://raw.githubusercontent.com/microservices-demo/microservices-demo/master/deploy/kubernetes/complete-demo.yaml
Verify if all pods have Istio injected. (Each microservice pod should show an extra container which is the Istio sidecar.)
kubectl get pods -n sock-shop
Deploy an Istio gateway and virtual service.
kubectl apply -f - <<EOF
apiVersion: networking.istio.io/v1alpha3
kind: Gateway
metadata:
 name: sock-gateway
 namespace: sock-shop
spec:
 selector:
   istio: ingressgateway
 servers:
 - port:
     number: 80
     name: http
     protocol: HTTP
   hosts:
   - "*"
---
apiVersion: networking.istio.io/v1alpha3
kind: VirtualService
metadata:
 name: sock
 namespace: sock-shop
spec:
 hosts:
 - "*"
 gateways:
 - sock-gateway
 http:
 - match:
   - uri:
       prefix: "/"
   route:
   - destination:
       host: front-end.sock-shop.svc.cluster.local
       port:
         number: 80
EOF
Open a tunnel to the Istio ingress gateway (= service mesh entry-point) to access the sock-shop application.
kubectl port-forward svc/istio-ingressgateway -n istio-system 8080:80
The sock-shop application is now available at http://localhost:8080
Install Prometheus with remote_write configuration.
The required details can be found in Grafana Cloud’s Prometheus metrics documentation (see also Prerequisites section).
export GC_PROMETHEUS_USERNAME=<my-grafana-cloud-prometheus-username>
export GC_API_KEY=<my-grafana-cloud-api-key>
export REMOTE_WRITE_ENDPOINT=<my-grafana-cloud-remote-write-endpoint>

kubectl create ns logging

kubectl create secret generic kubepromsecret
  --from-literal=username=${GC_PROMETHEUS_USERNAME}
  --from-literal=password=${GC_API_KEY}
  -n logging

helm upgrade --install prometheus -n logging bitnami/kube-prometheus --version 6.6.0 -f - <<EOF
prometheus:
  remoteWrite:
  - url: ${REMOTE_WRITE_ENDPOINT}
    basicAuth:
      username:
        name: kubepromsecret
        key: username
      password:
        name: kubepromsecret
        key: password
EOF
Install Promtail as daemonset.
export GC_LOKI_USER=<my-grafana-cloud-loki-user>
export GC_API_KEY=<my-grafana-cloud-api-key>
export GC_LOKI_URL=<my-grafana-cloud-loki-url>

kubectl create secret generic kubelokisecret
  --from-literal=username=${GC_LOKI_USER}
  --from-literal=password=${GC_API_KEY}
  -n logging

helm upgrade --install promtail -n logging grafana/promtail --version 3.8.1 -f - <<EOF
extraArgs:
  - -config.expand-env=true
extraEnvFrom:
  - secretRef:
      name: kubelokisecret
config:
  logLevel: debug
  serverPort: 9080
  lokiAddress: "https://${username}:${password}@${GC_LOKI_URL}/loki/api/v1/push"
  snippets:
    pipelineStages:
      - match:
          selector: '{app="istio-ingressgateway"}'
          stages:
          # sample: accesslog [xxxx-xx-xxxxx:xxxxxxxxxx] "GET /category.html?tags=formal"
          # sample: accesslog [xxxx-xx-xxxxx:xxxxxxxxxx] "GET /category.html?tags=geek"
          - regex:
              expression: ^.*GET /category.html?tags=(?P<filter>geek)"
          - regex:
              expression: ^.*GET /category.html?tags=(?P<filter>formal)"
          - labels:
              filter:
          - metrics:
              filter:
                prefix: 'analytics_'
                type: Counter
                description: "Total count of filtered results"
                source: filter
                config:
                  action: inc
serviceMonitor:
  enabled: true
  namespaceSelector: {}
  annotations: {}
  labels: {}
  interval: 10s
  scrapeTimeout: 5s
EOF
Port-forward both Prometheus and Promtail.
kubectl -n logging port-forward svc/prometheus-kube-prometheus-prometheus 9090:9090
kubectl -n logging port-forward ds/promtail 9080:9080
The Grafana Dashboard
Let’s have a look at some pairs of socks by browsing through the catalog on the website while filtering on either “formal” or “geek” (this will create the required traffic).
In your browser open http://localhost:9080/metrics to consult Promtail metrics. Search for analytics_filter related entries.
On http://localhost:9090 Prometheus will visualize the metrics in the graph section when executing analytics_filter. These entries are forwarded to Grafana Cloud.
Side note: An alternate way of creating the setup in this post would be to use the Grafana Agent, which bundles the Prometheus discovery, WAL and remote_write capabilities without the local TSDB, and also bundles Promtail. Check out the Grafana Agent Quickstart guide.
Let’s consult the data on Grafana Cloud! On the Grafana Cloud Portal, you can log into Grafana to start using it by clicking “Log In.” On the Grafana General/Home page, you can create a new dashboard to visualize the generated metrics.
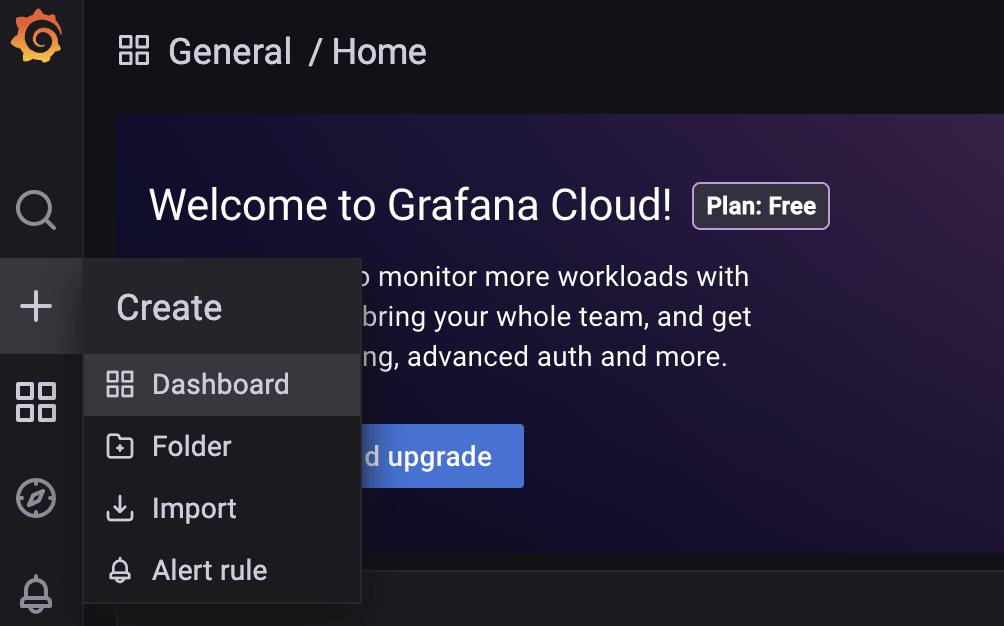
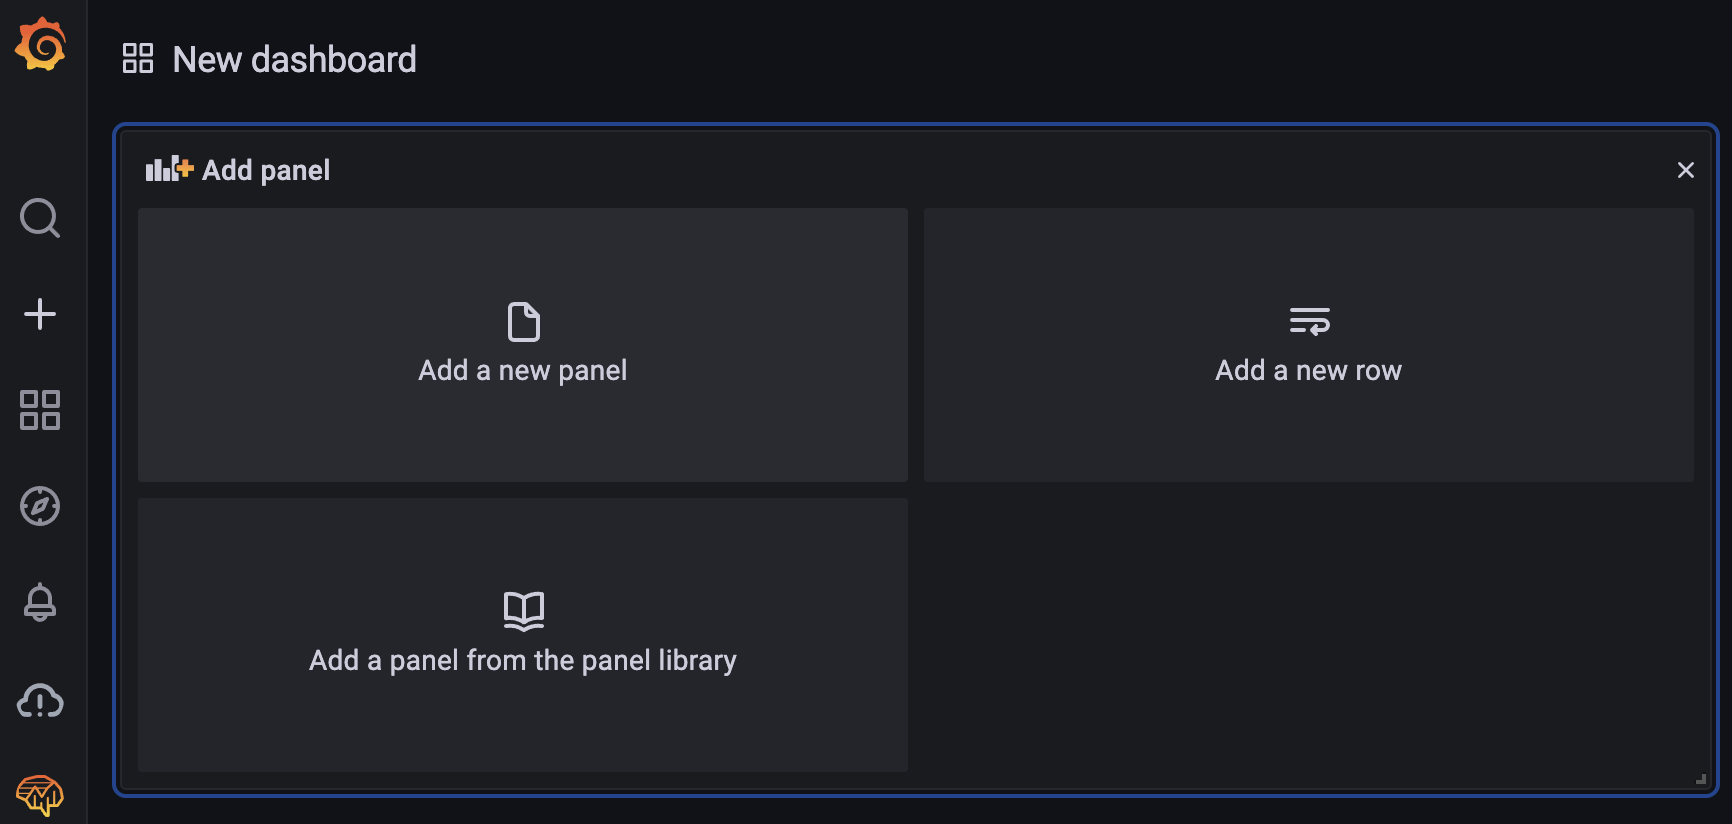
Let’s add a panel to the newly created dashboard by clicking “Add a new panel.”
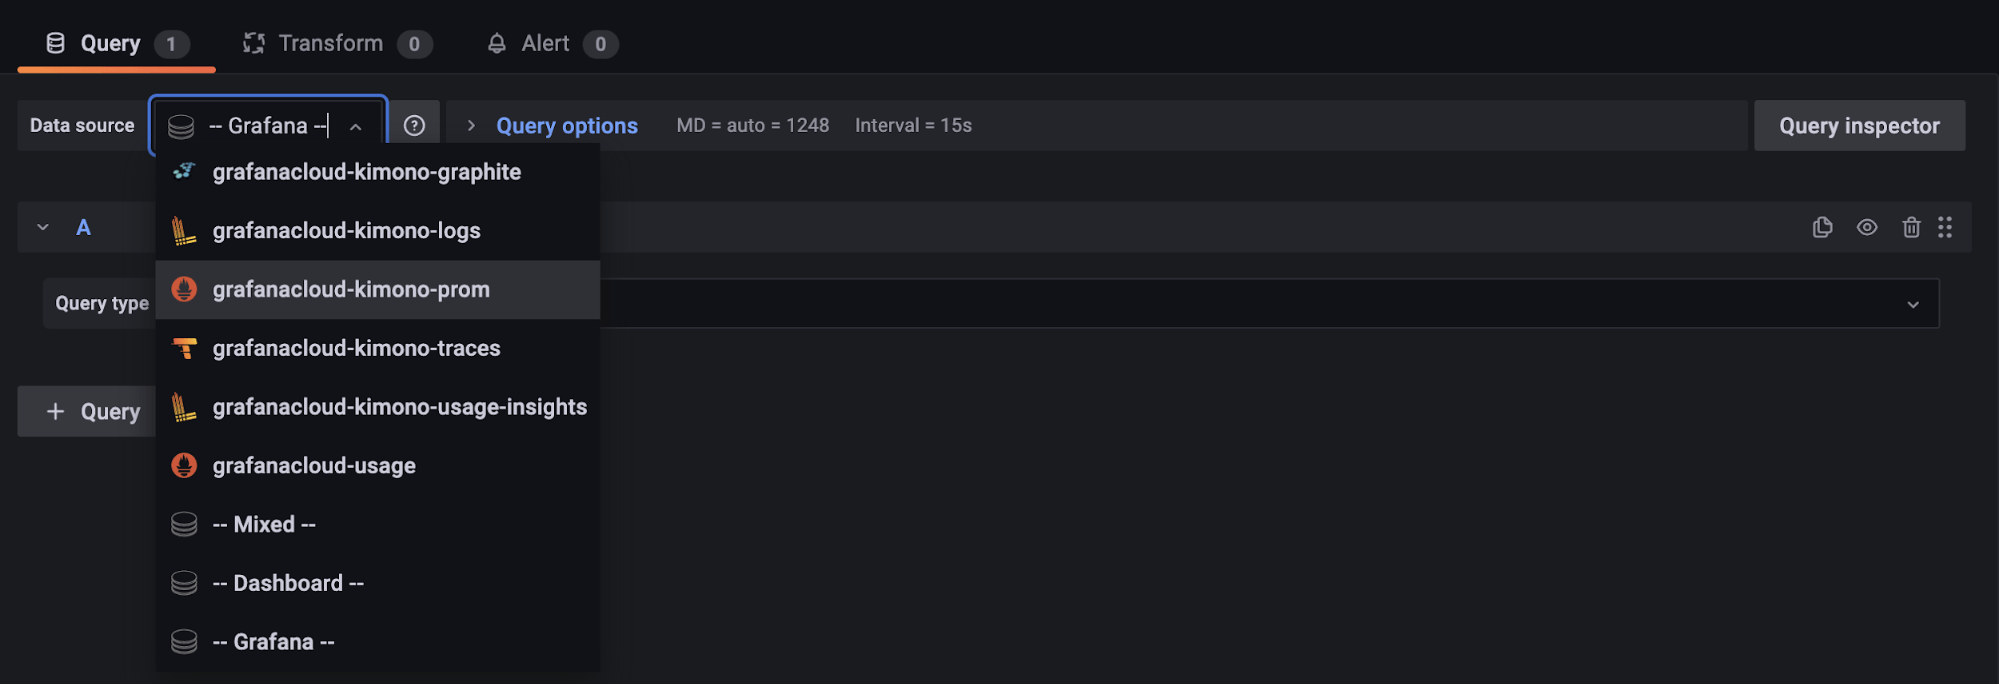
Next, you define a query. From the “Data source” pulldown menu select grafanacloud-< your-grafana-cloud-stack-name >-prom to set Prometheus as data source.
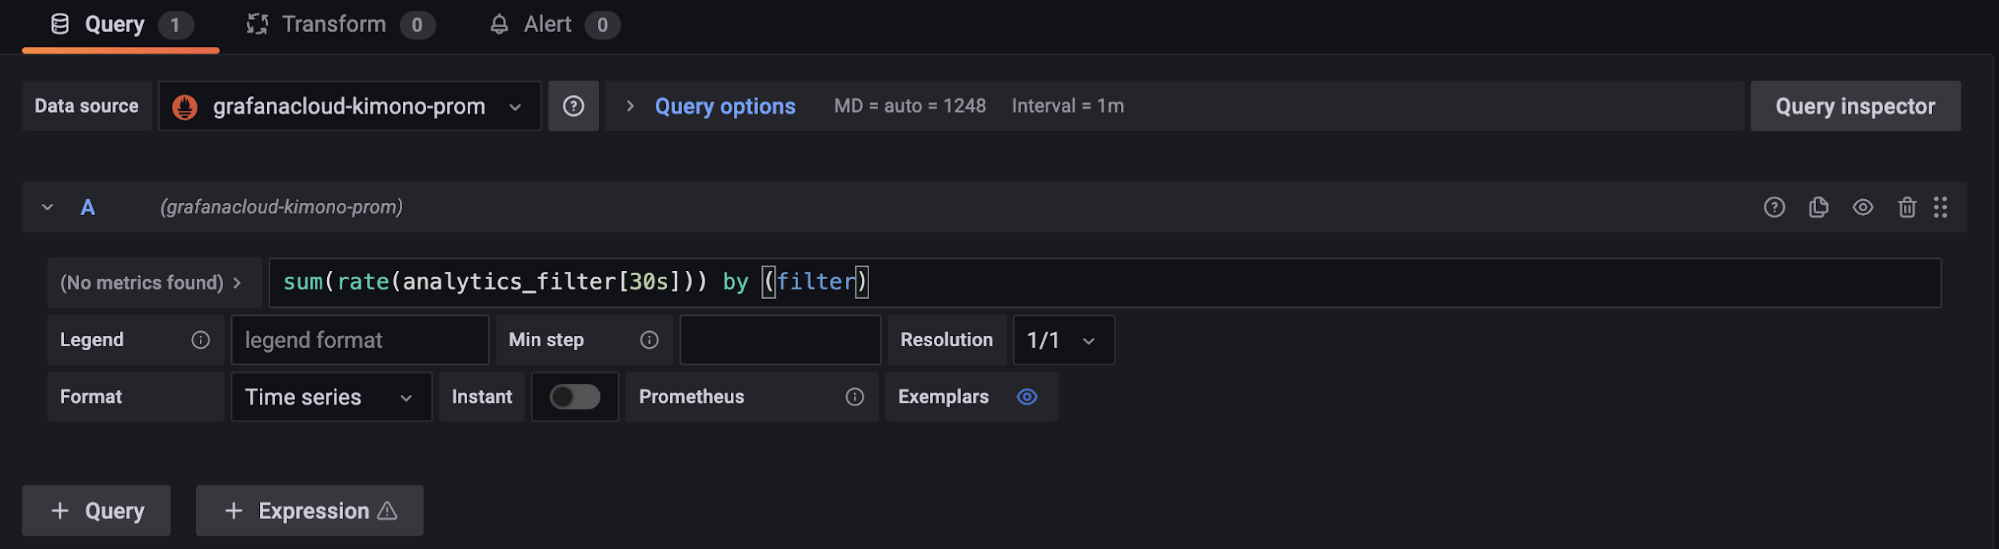
Nearly done. Define your query and possibly give the panel a title. Here you will use:
sum(rate(analytics_filter[30s])) by (filter)
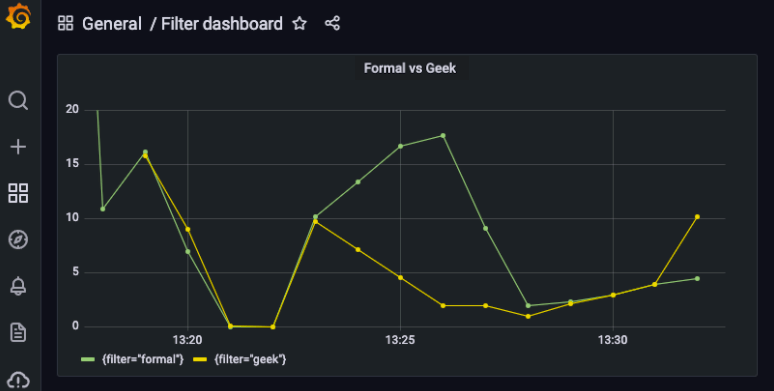
Click on “Apply” (top right corner of the page). Here you go!
You can add another panel to visualize the logs. Select grafanacloud-< your-grafana-cloud-stack-name >-logs to set Loki as the data source. Choose either Table or Logs as Visualization and define your query e.g. {filter=”geek”}.

Final thoughts
So the end result allows you to understand how both “formal” and “geek” socks are trending. The visualization of these metrics will surely help you to better understand what customers are looking for and guide you towards better business decisions that generate more revenue.
How to turn application logs into useful metrics with Gloo Edge and Grafana is a real use case story where Promtail is leveraged by Gloo Edge to find corner cases on one of its components: ExtAuth. The metric is used to signal and alert about a misconfiguration.
Knowing this approach, you can leverage the same setup to get metrics from your logs and not just to obtain some sort of analytics, but to understand better how your system works for DevOps purposes.
